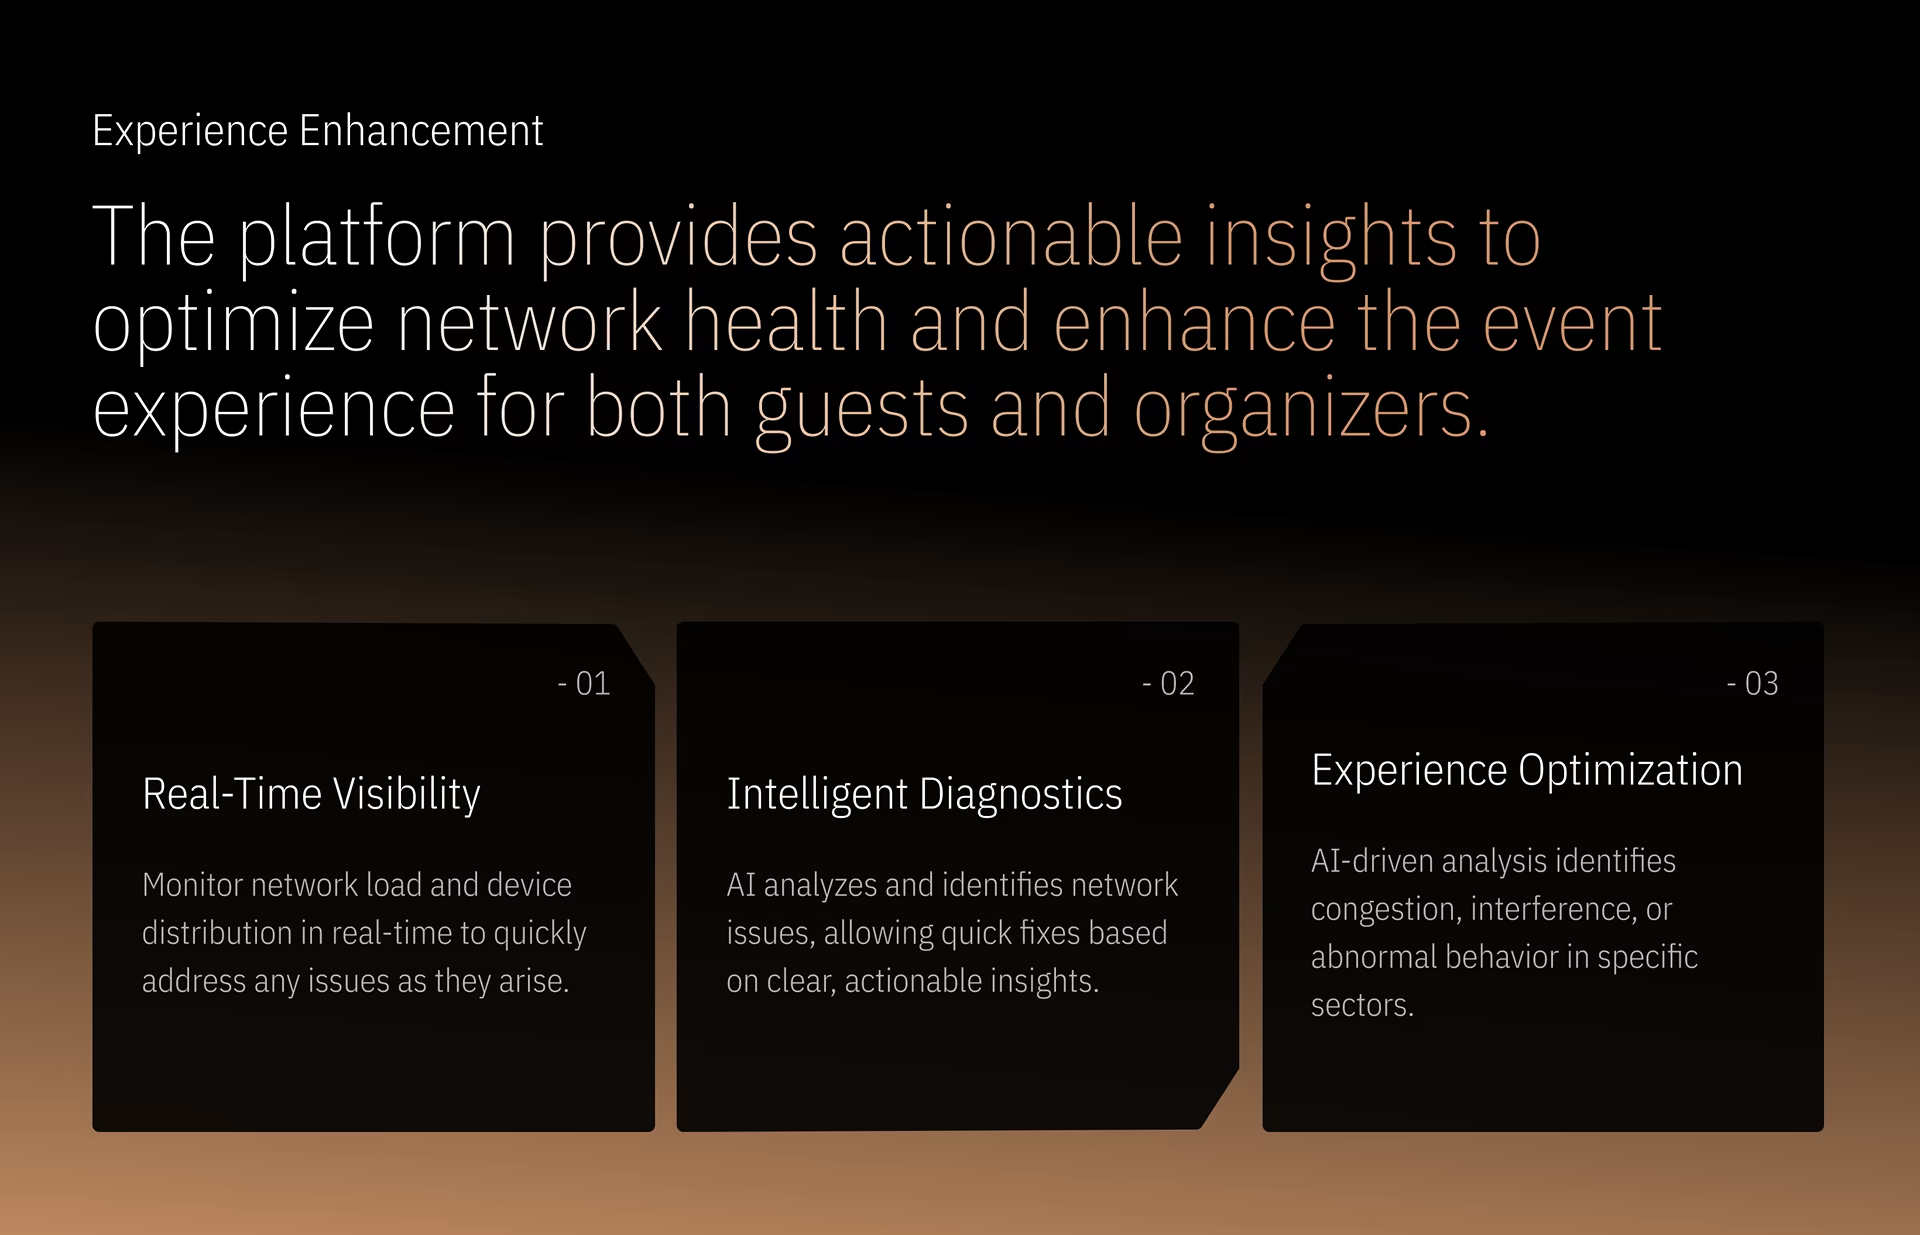
The platform provides actionable insights to optimize network health and enhance the event experience for both guests and organizers.
AI-Powered Event Monitoring and Timeline Tracking
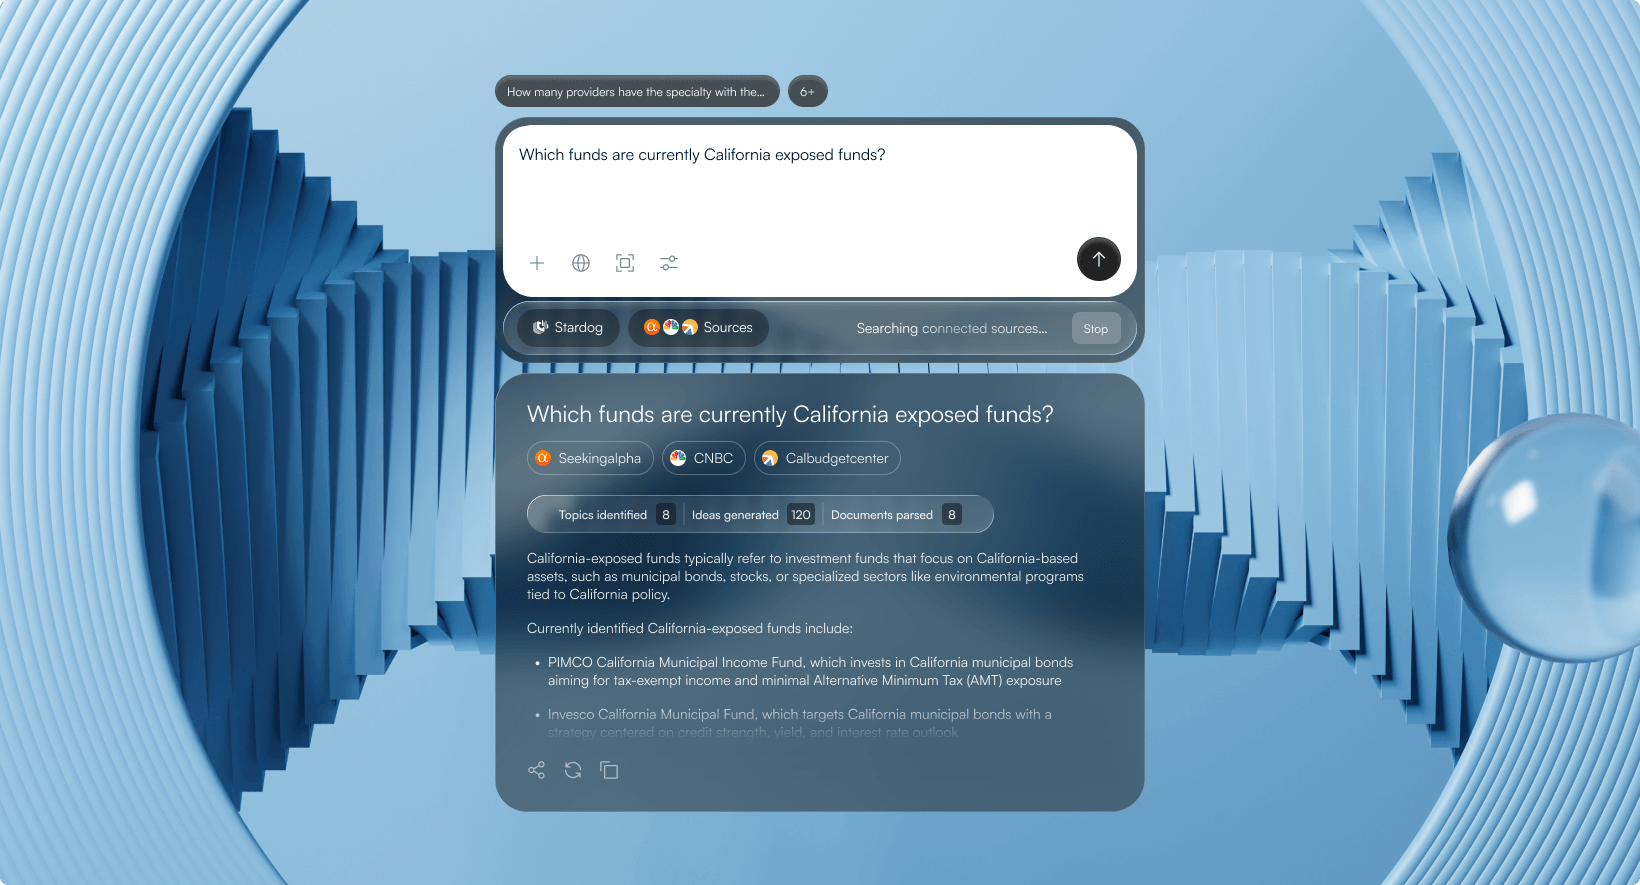
AI Chat Insights: Provide real-time event analysis through dashboards for digital twin design and development, including key metrics like guest count, data usage, and network health. The AI Chat offers actionable insights on network issues such as interference and alarms, helping event managers stay informed and respond quickly.
Our NextGen interface tracks the network performance in real-time with a timeline that highlights fluctuations in data usage and signal strength. This helps visualize network performance over the event’s duration, offering insights into peak demand times.
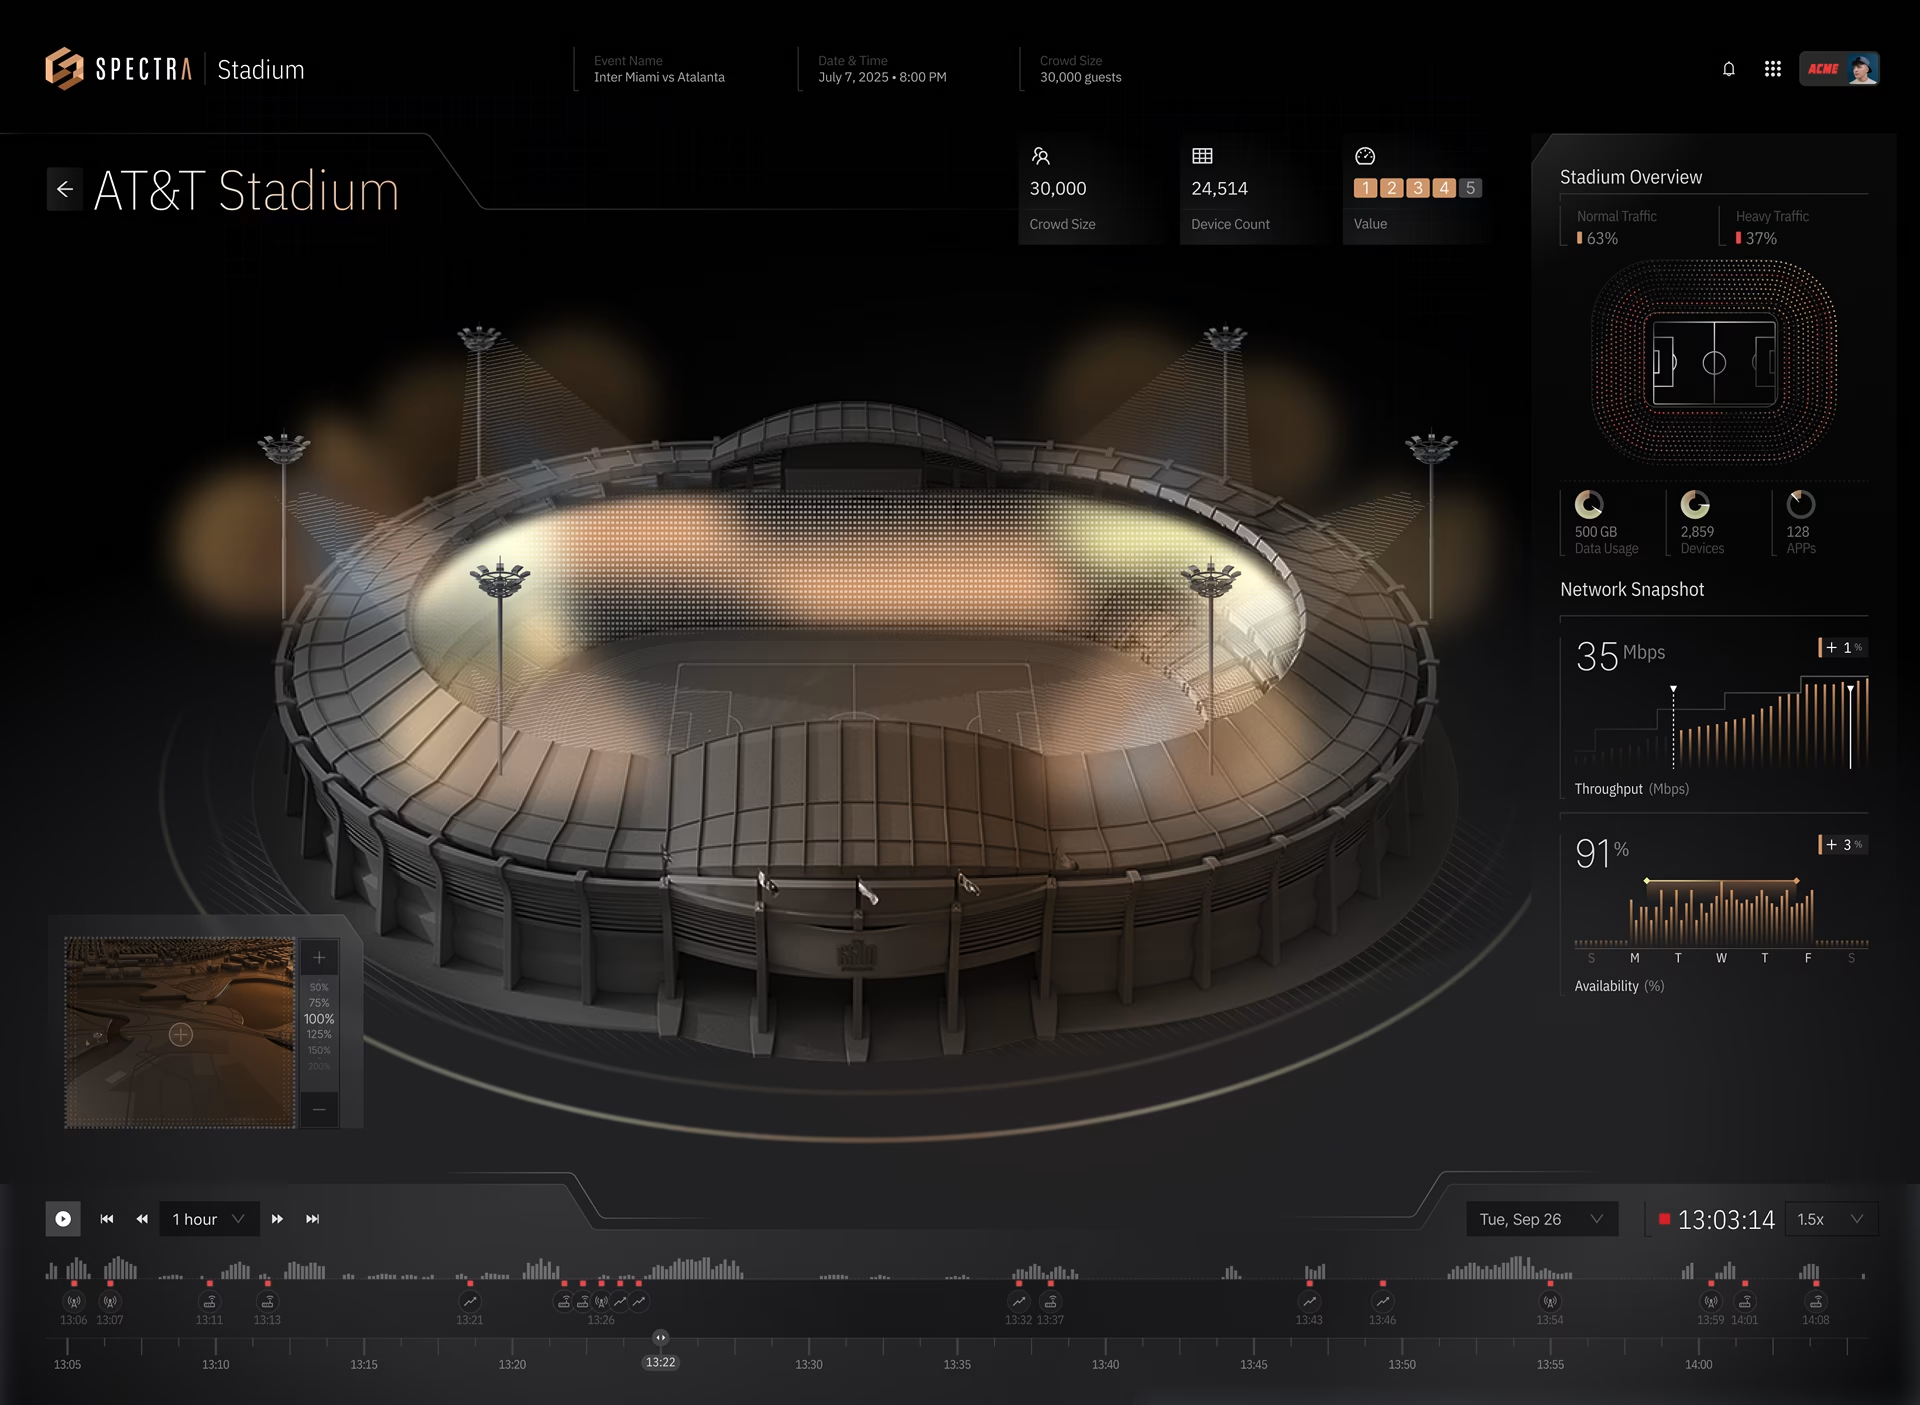
Stadiums like AT&T stadium in Texas are leading the way by including SaaS 5g data systems for actionable insights that lead to a better experience for attendees and useful marketing data for event management teams.
Network Usage Breakdown and Heatmap
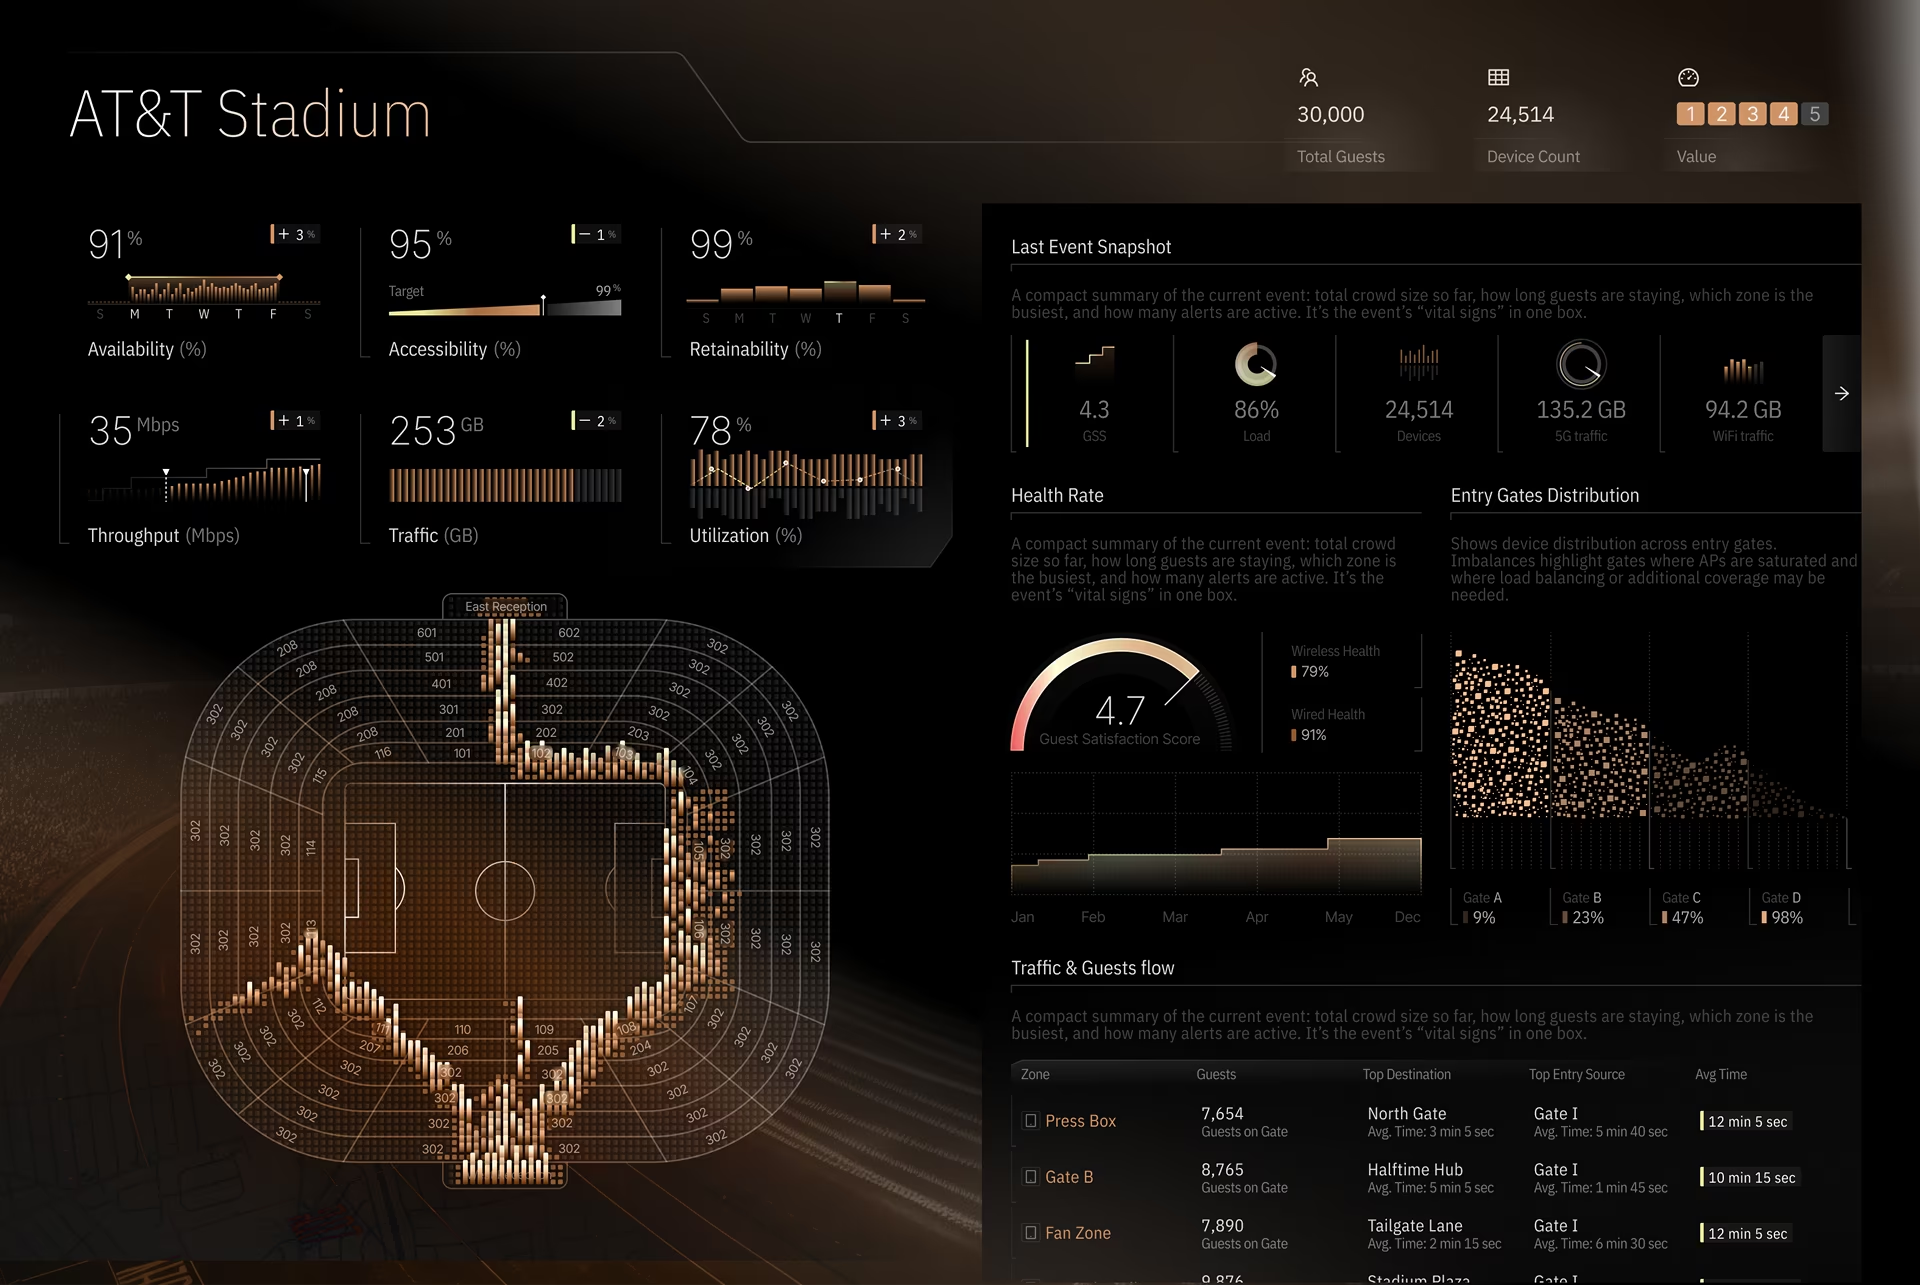
This section provides a detailed breakdown of Wi-Fi and 5G data dashboard depicts usage across the event. It tracks throughput, network health scores, and compares the performance of different segments of the event.
The heatmap data visualization offers a visual representation of network performance across the venue in real-time, highlighting areas with high traffic and identifying any performance bottlenecks or congestion that need attention for network managers to address using our CLI interface for the quickest resolution possible.
Complete KPI & Analytics Breakdown
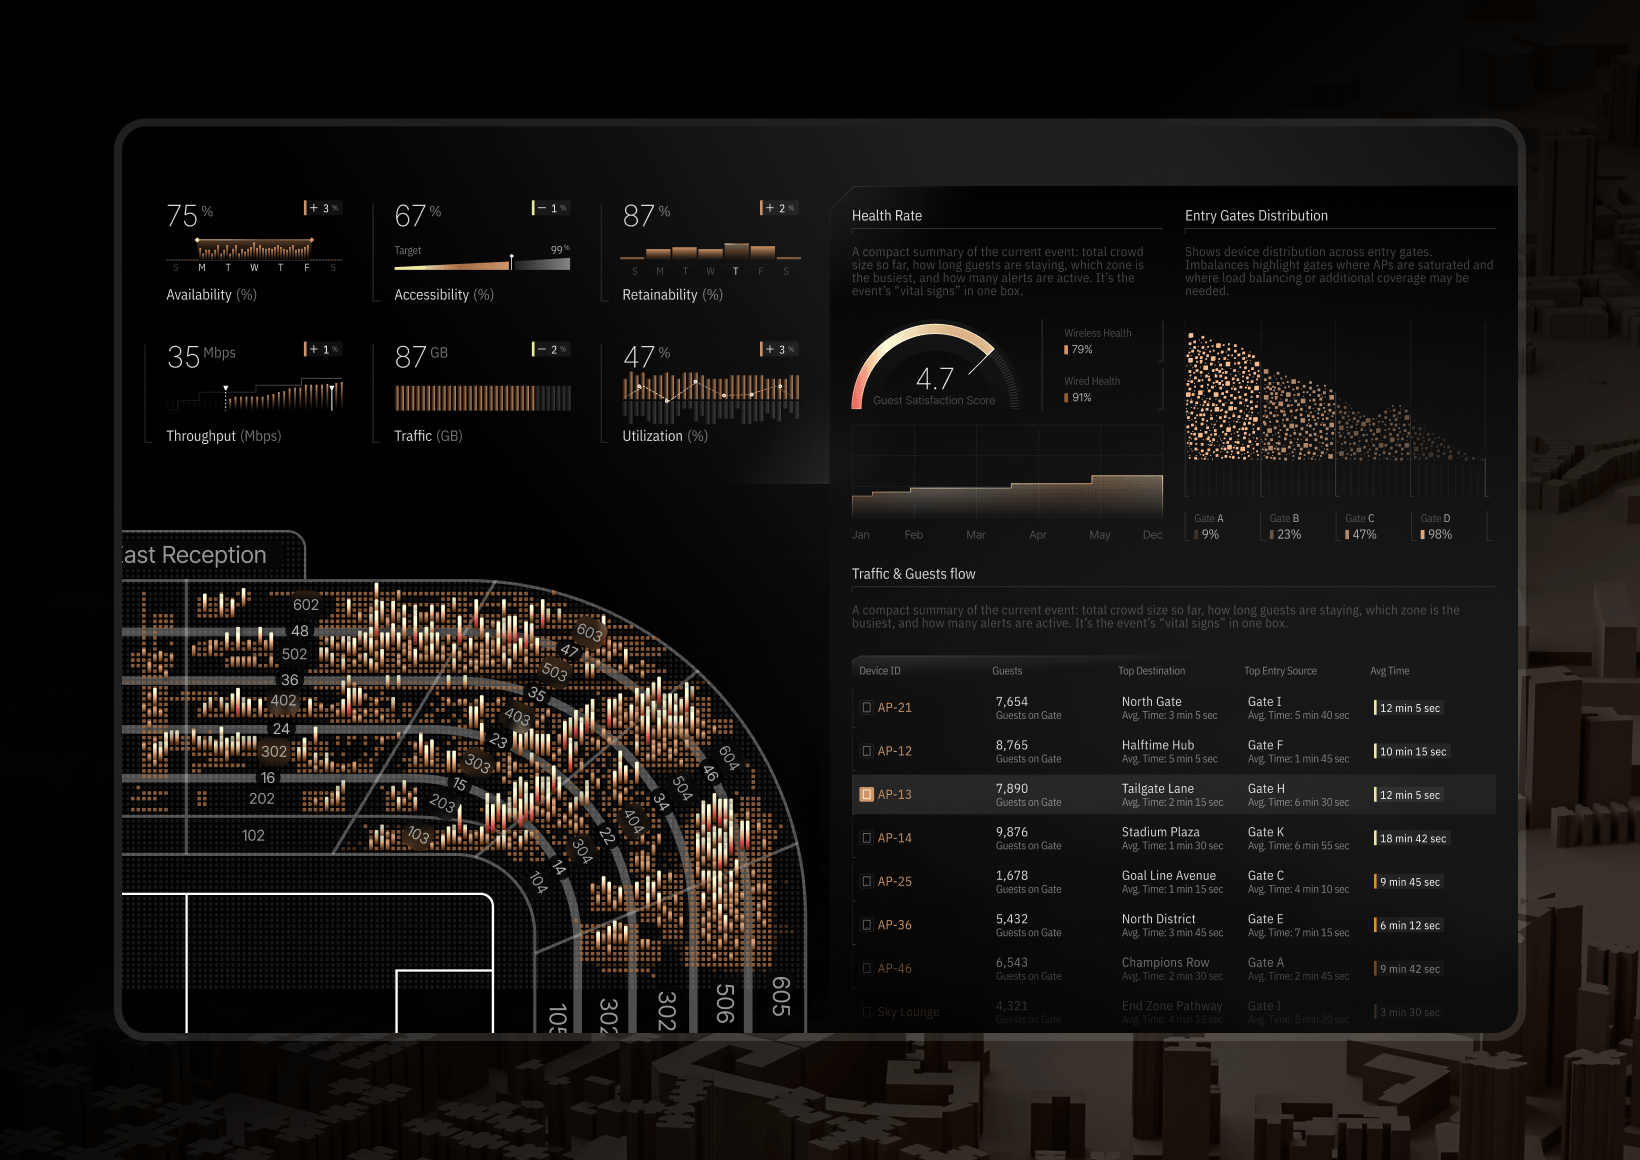
A consolidated view of all performance indicators across the stadium, including network usage, availability, throughput, device distribution, guest flow, and satisfaction analytics metrics created on the spot, providing network monitors an authentic digital twin experience.
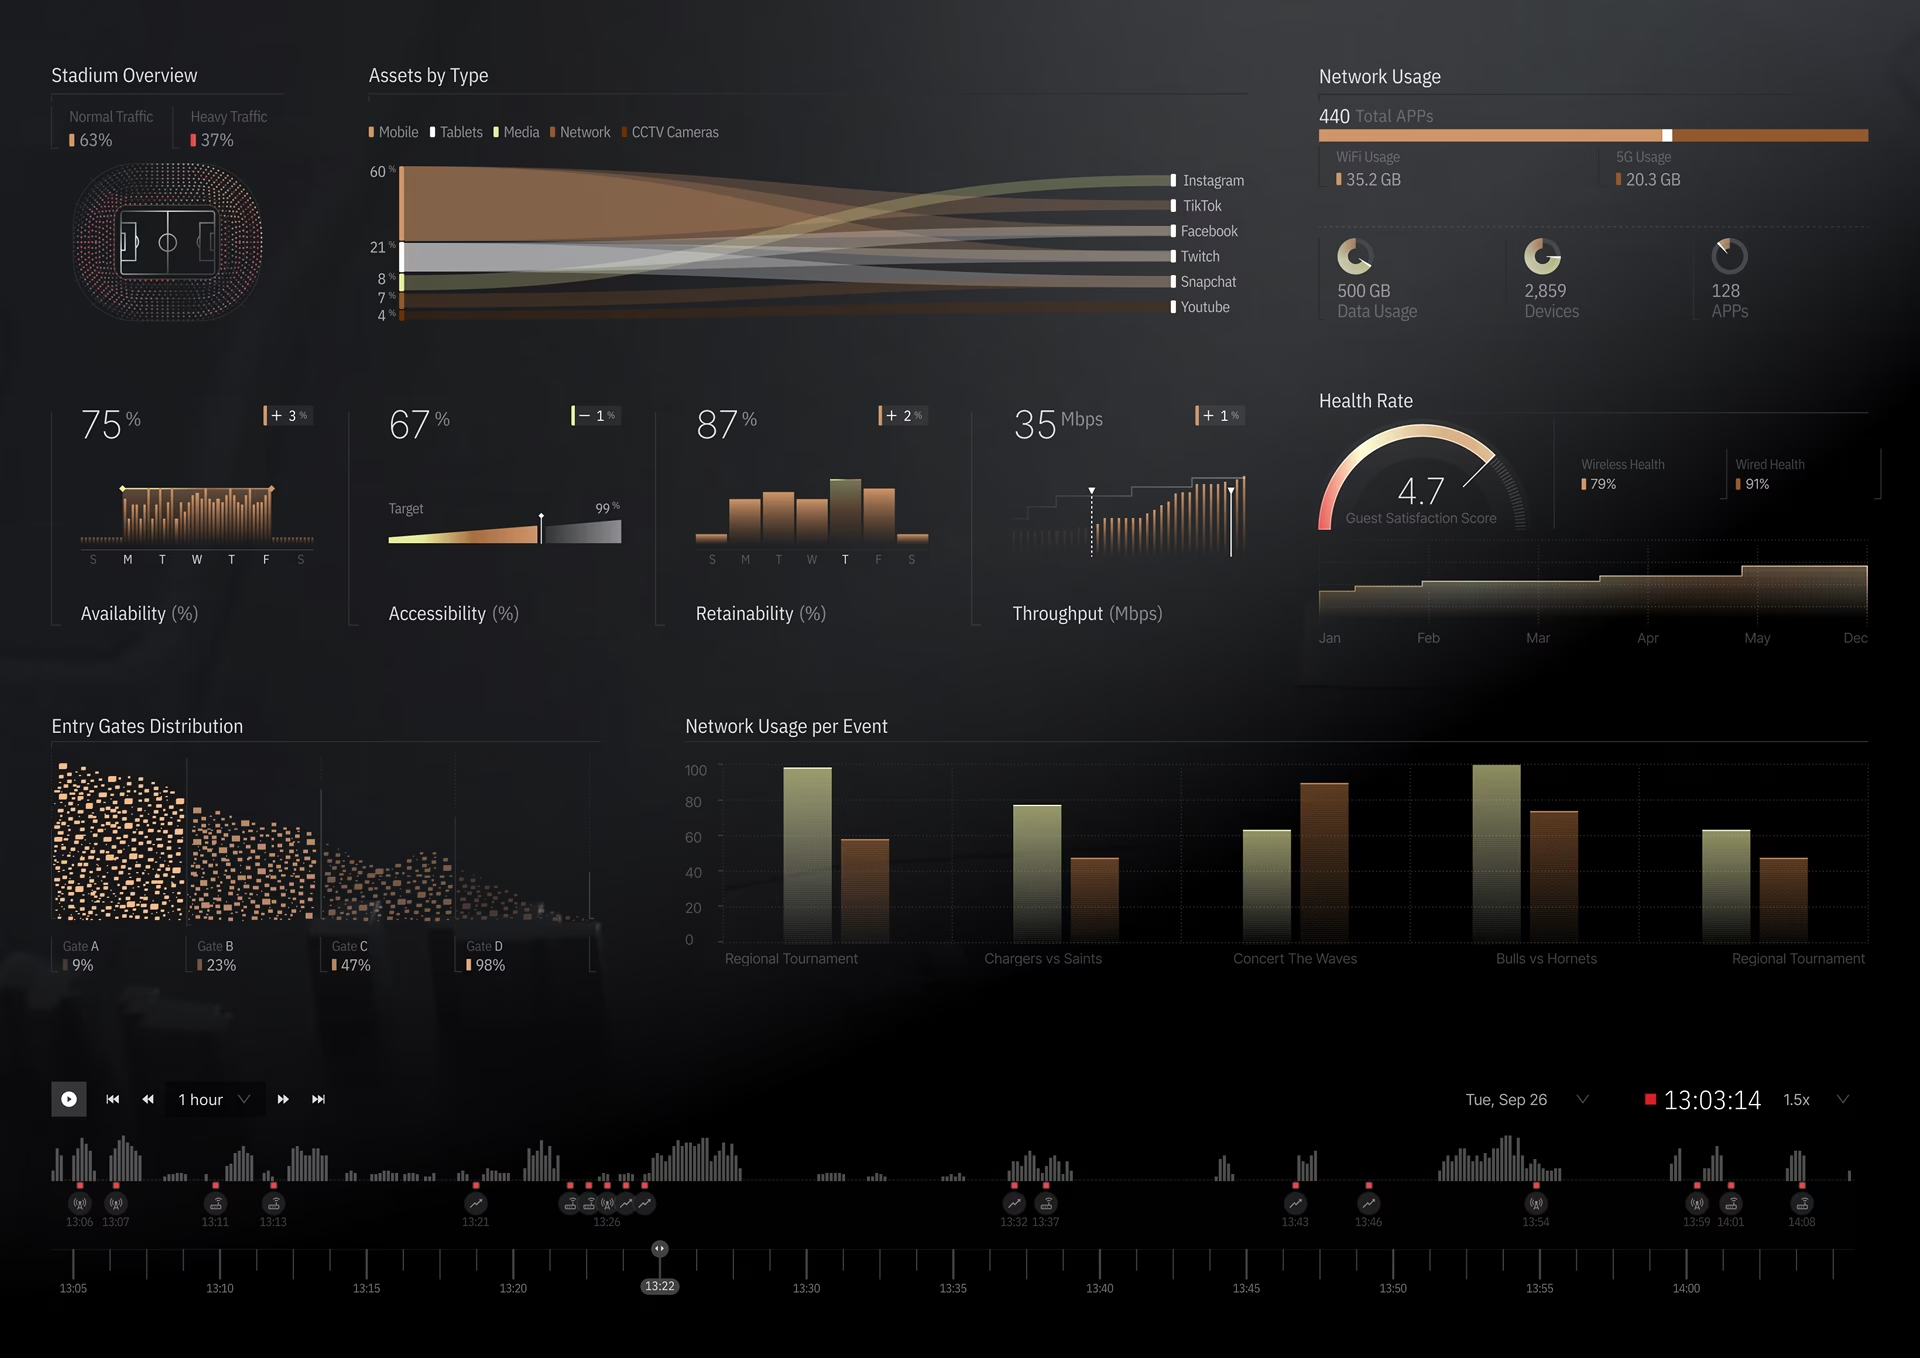
Network Load and Zoom-In Issue Tracking
The timeline visual interface captures spikes and dips in network load, providing real-time insights into the data flow across the event. It helps identify when and where the network is under stress, guiding event technology staff in their optimization efforts.
By zooming into specific areas on the map, network issues can be pinpointed. This feature enables quick identification of problematic zones, allowing for faster troubleshooting and issue resolution.
Stadium-Wide Network Health and Infrastructure Breakdown
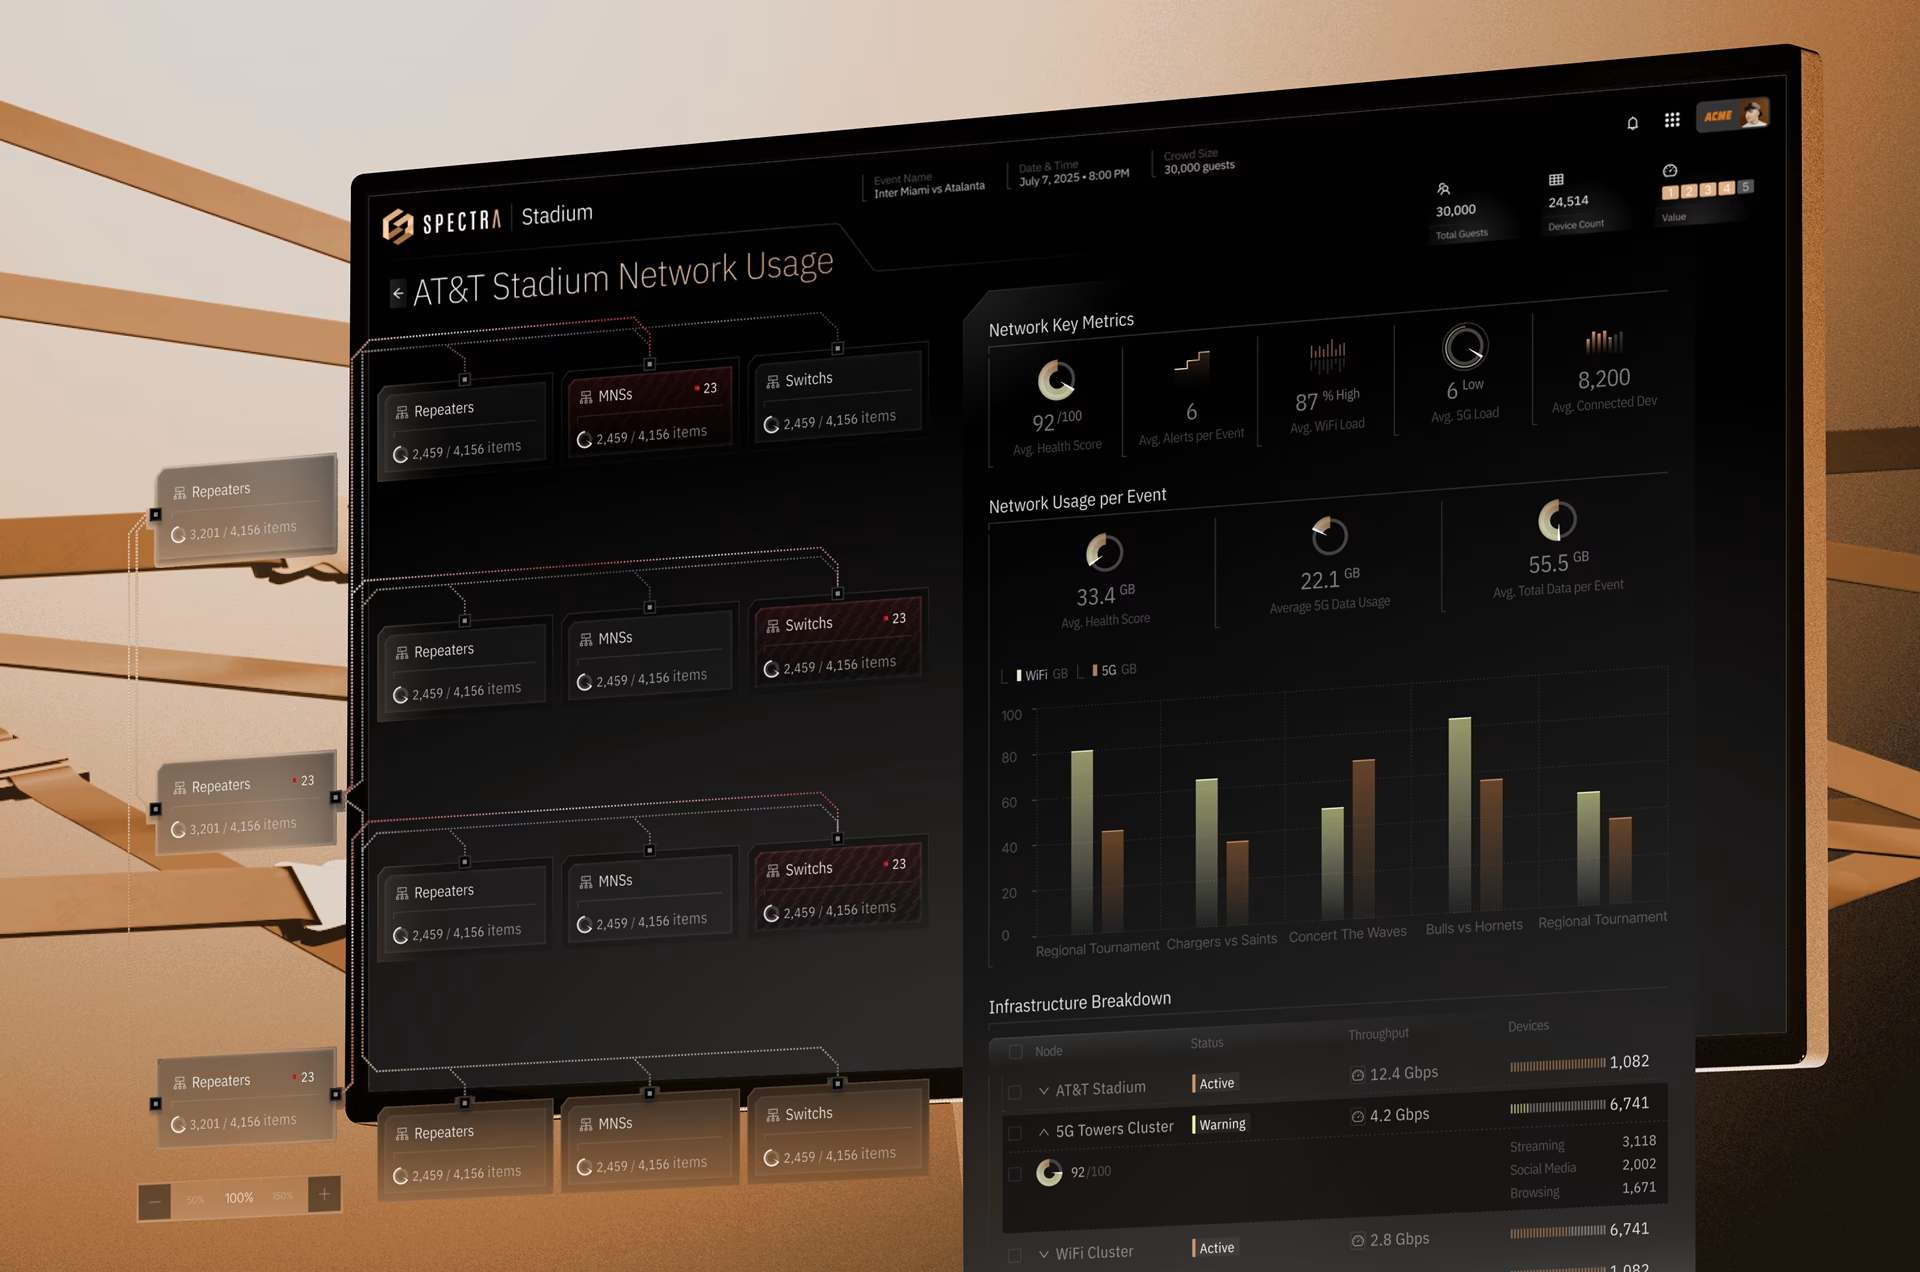
There are multiple stadium-wide views of the network performance produced by the Fuselab Creative GenUI system, creating a personally dynamic environment for user needs in real-time and producing a software experience that feels incredibly intuitive for each user’s needs.
Displays the performance of various network hardware components (repeaters, switches, access points) within the stadium. This breakdown aids in assessing the health of each part of the infrastructure and ensures optimal network distribution.
Guest Traffic Flow and Network Performance at Key Locations
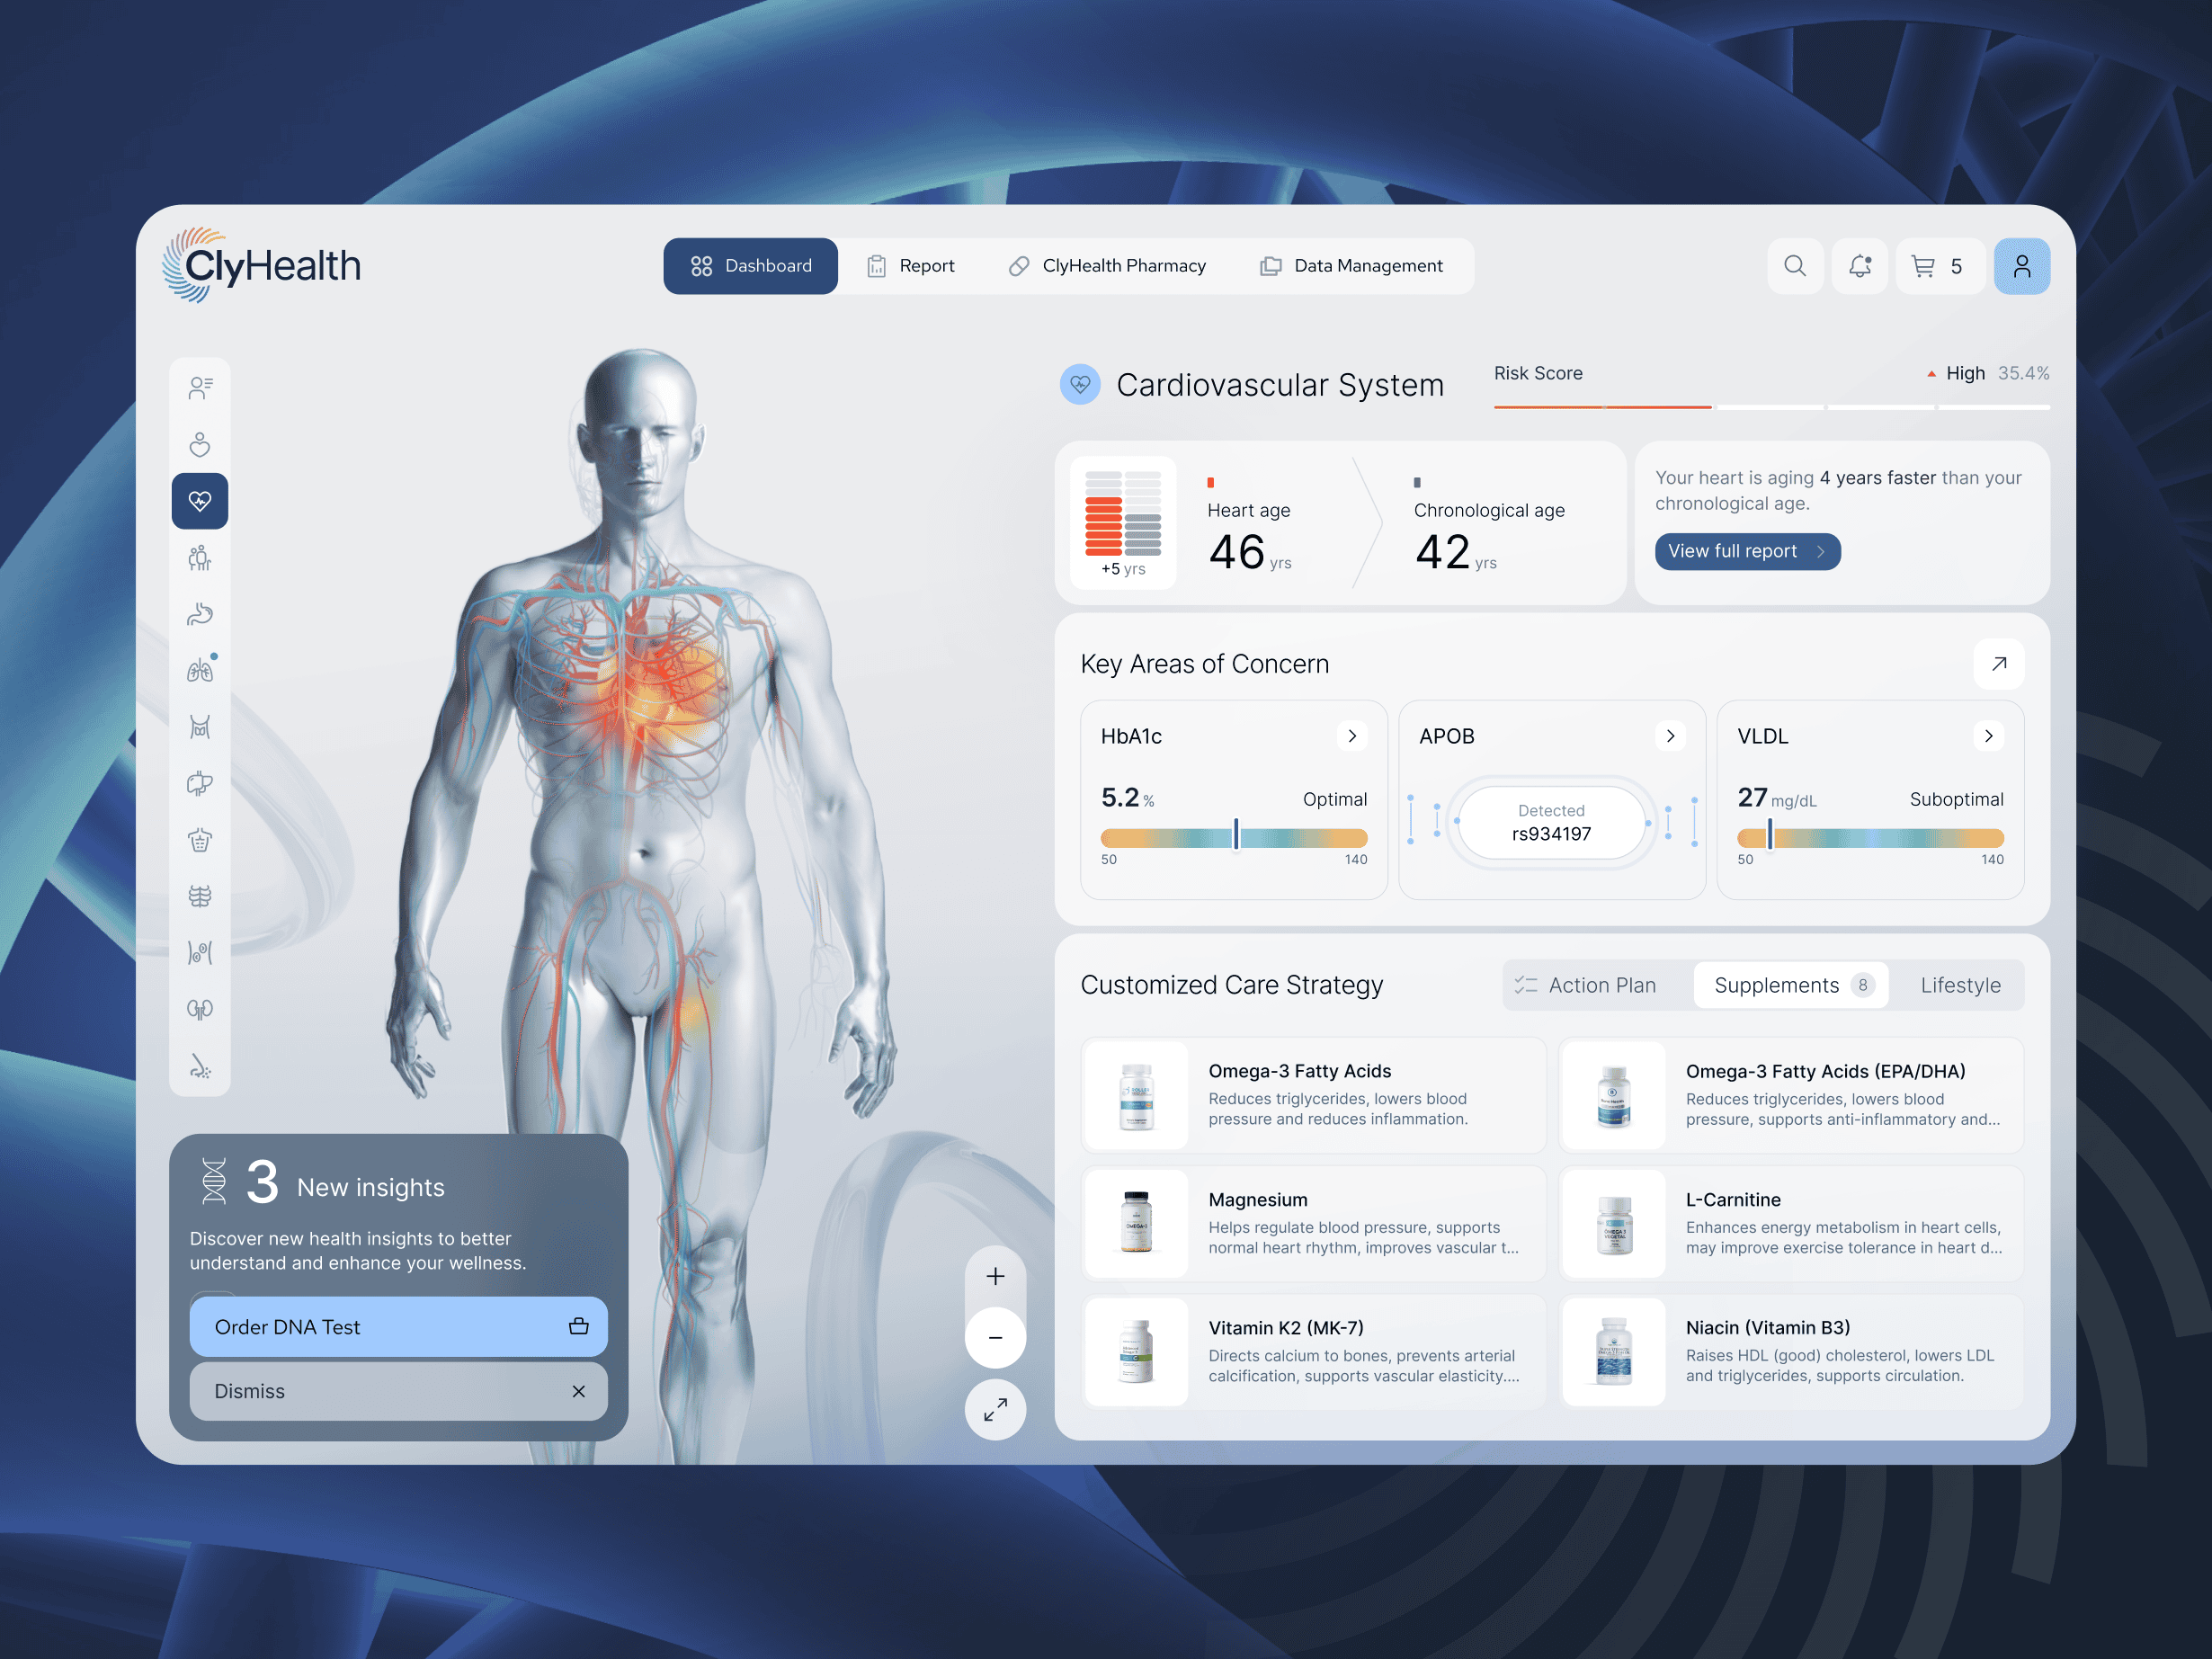
With ClyHealth and its internal AI assistant, users can swiftly access accurate and personalized insights about their health, alleviating worries and enhancing their understanding of their overall health landscape. The AI chat reviews your medical data, highlights important patterns, and simplifies complex information into clear, actionable insights. All ClyHealth systems have undergone extensive user testing with both patients and healthcare professionals. Moreover, we engaged an independent health safety panel to evaluate the UI and functionality, ensuring this system is optimized for every potential user or health-related stakeholder.