Start
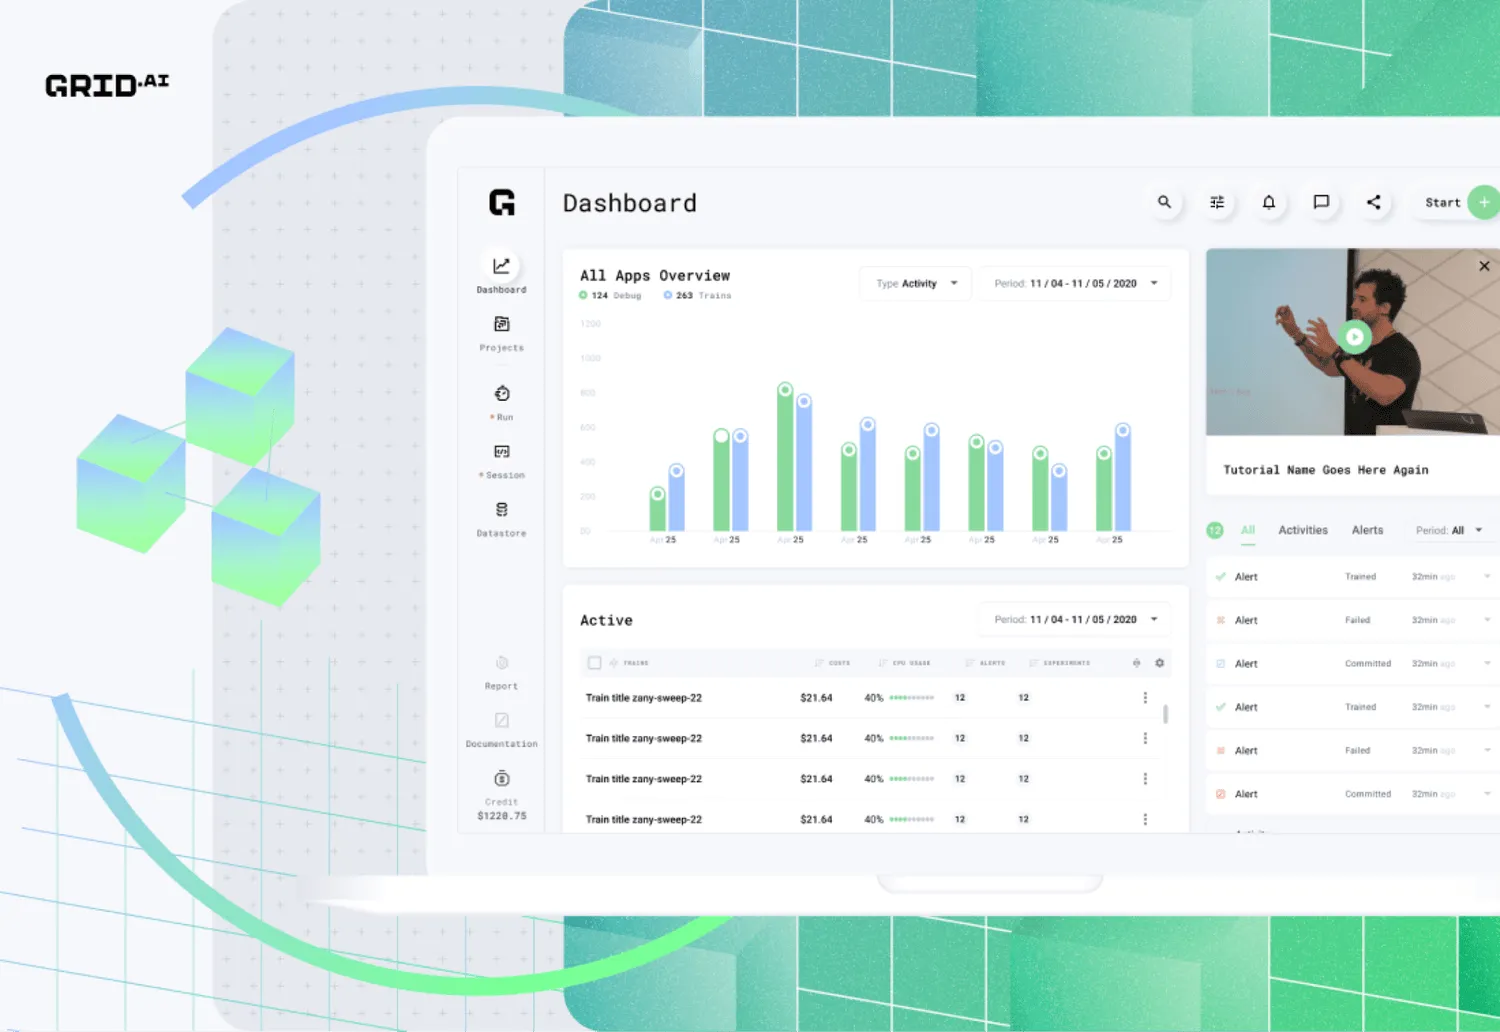
Users can track their experiments, address data issues, calculate costs, and evaluate successes or failures—all within a single dashboard. They can also create personalized workspaces with customized projects that organize experiments, sessions, and reports for each run. Additionally, total costs remain visible at all times, ensuring clear oversight and simplified administrative management.
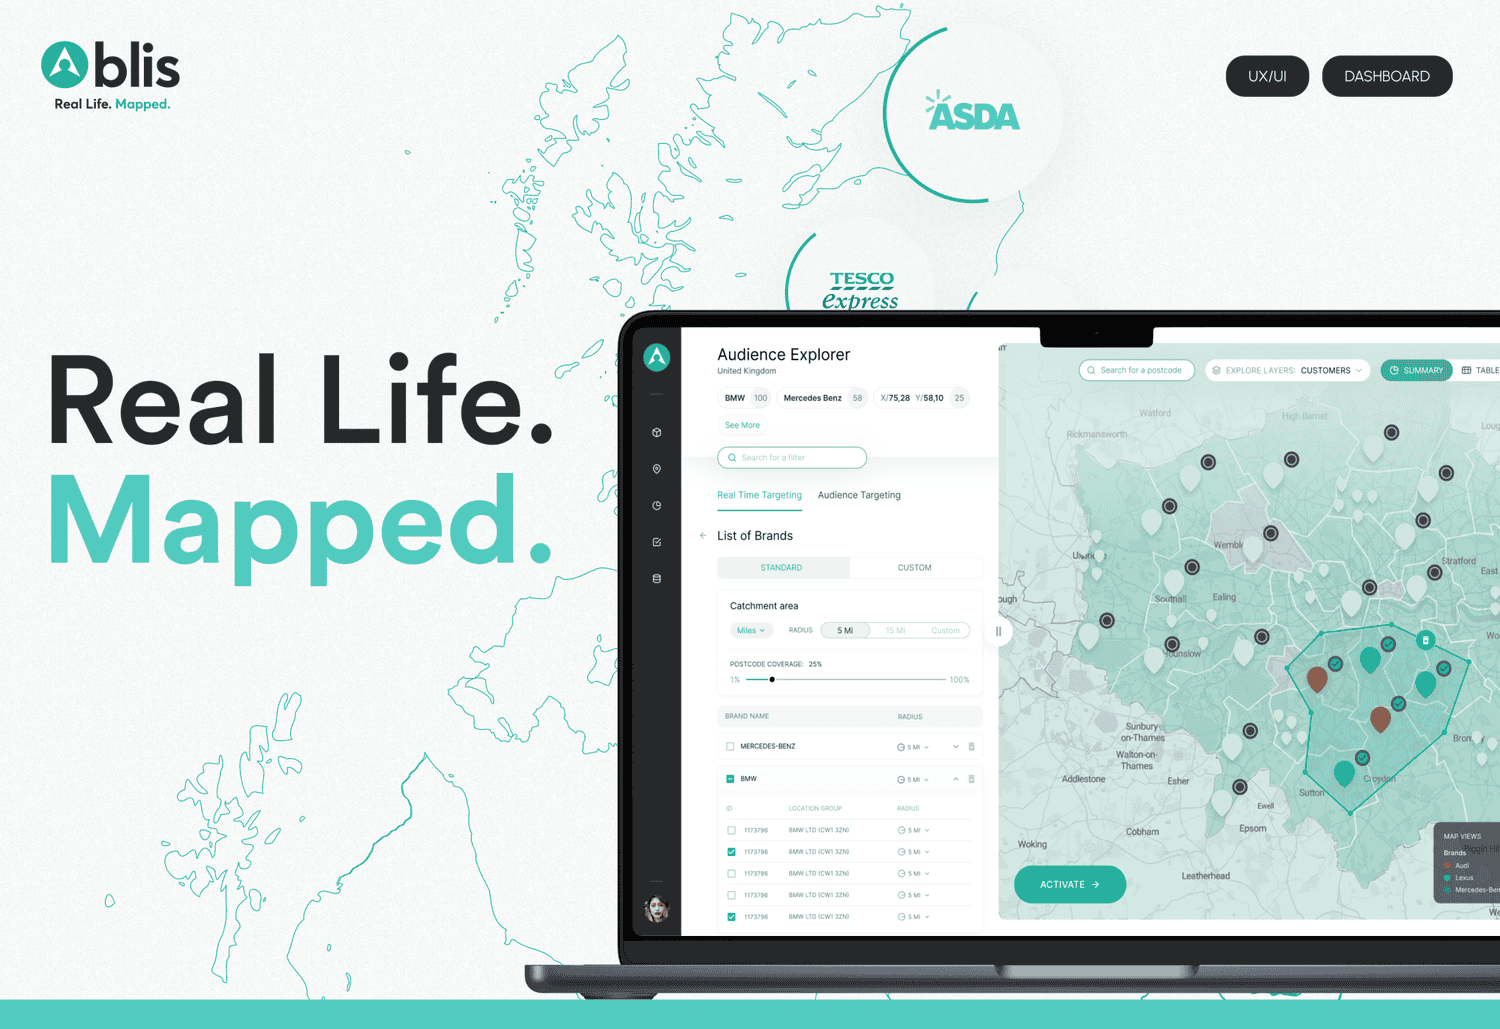
User Experience at the Core
The platform’s UX was designed to operate seamlessly within a single screen, enabling filtering and tabular navigation without requiring users to leave the dashboard. This streamlined approach allows users to personalize their experience without confusion, while simultaneously accessing actionable data and dynamic visualizations. These enhancements not only increase the platform’s usability but also highlight its value, encouraging ongoing engagement and deeper exploration.

Precision in Every Pixel
Almost every project we deliver includes a comprehensive design system, ensuring that clients can maintain a high level of self-sufficiency and consistency as they move forward.
Data Display
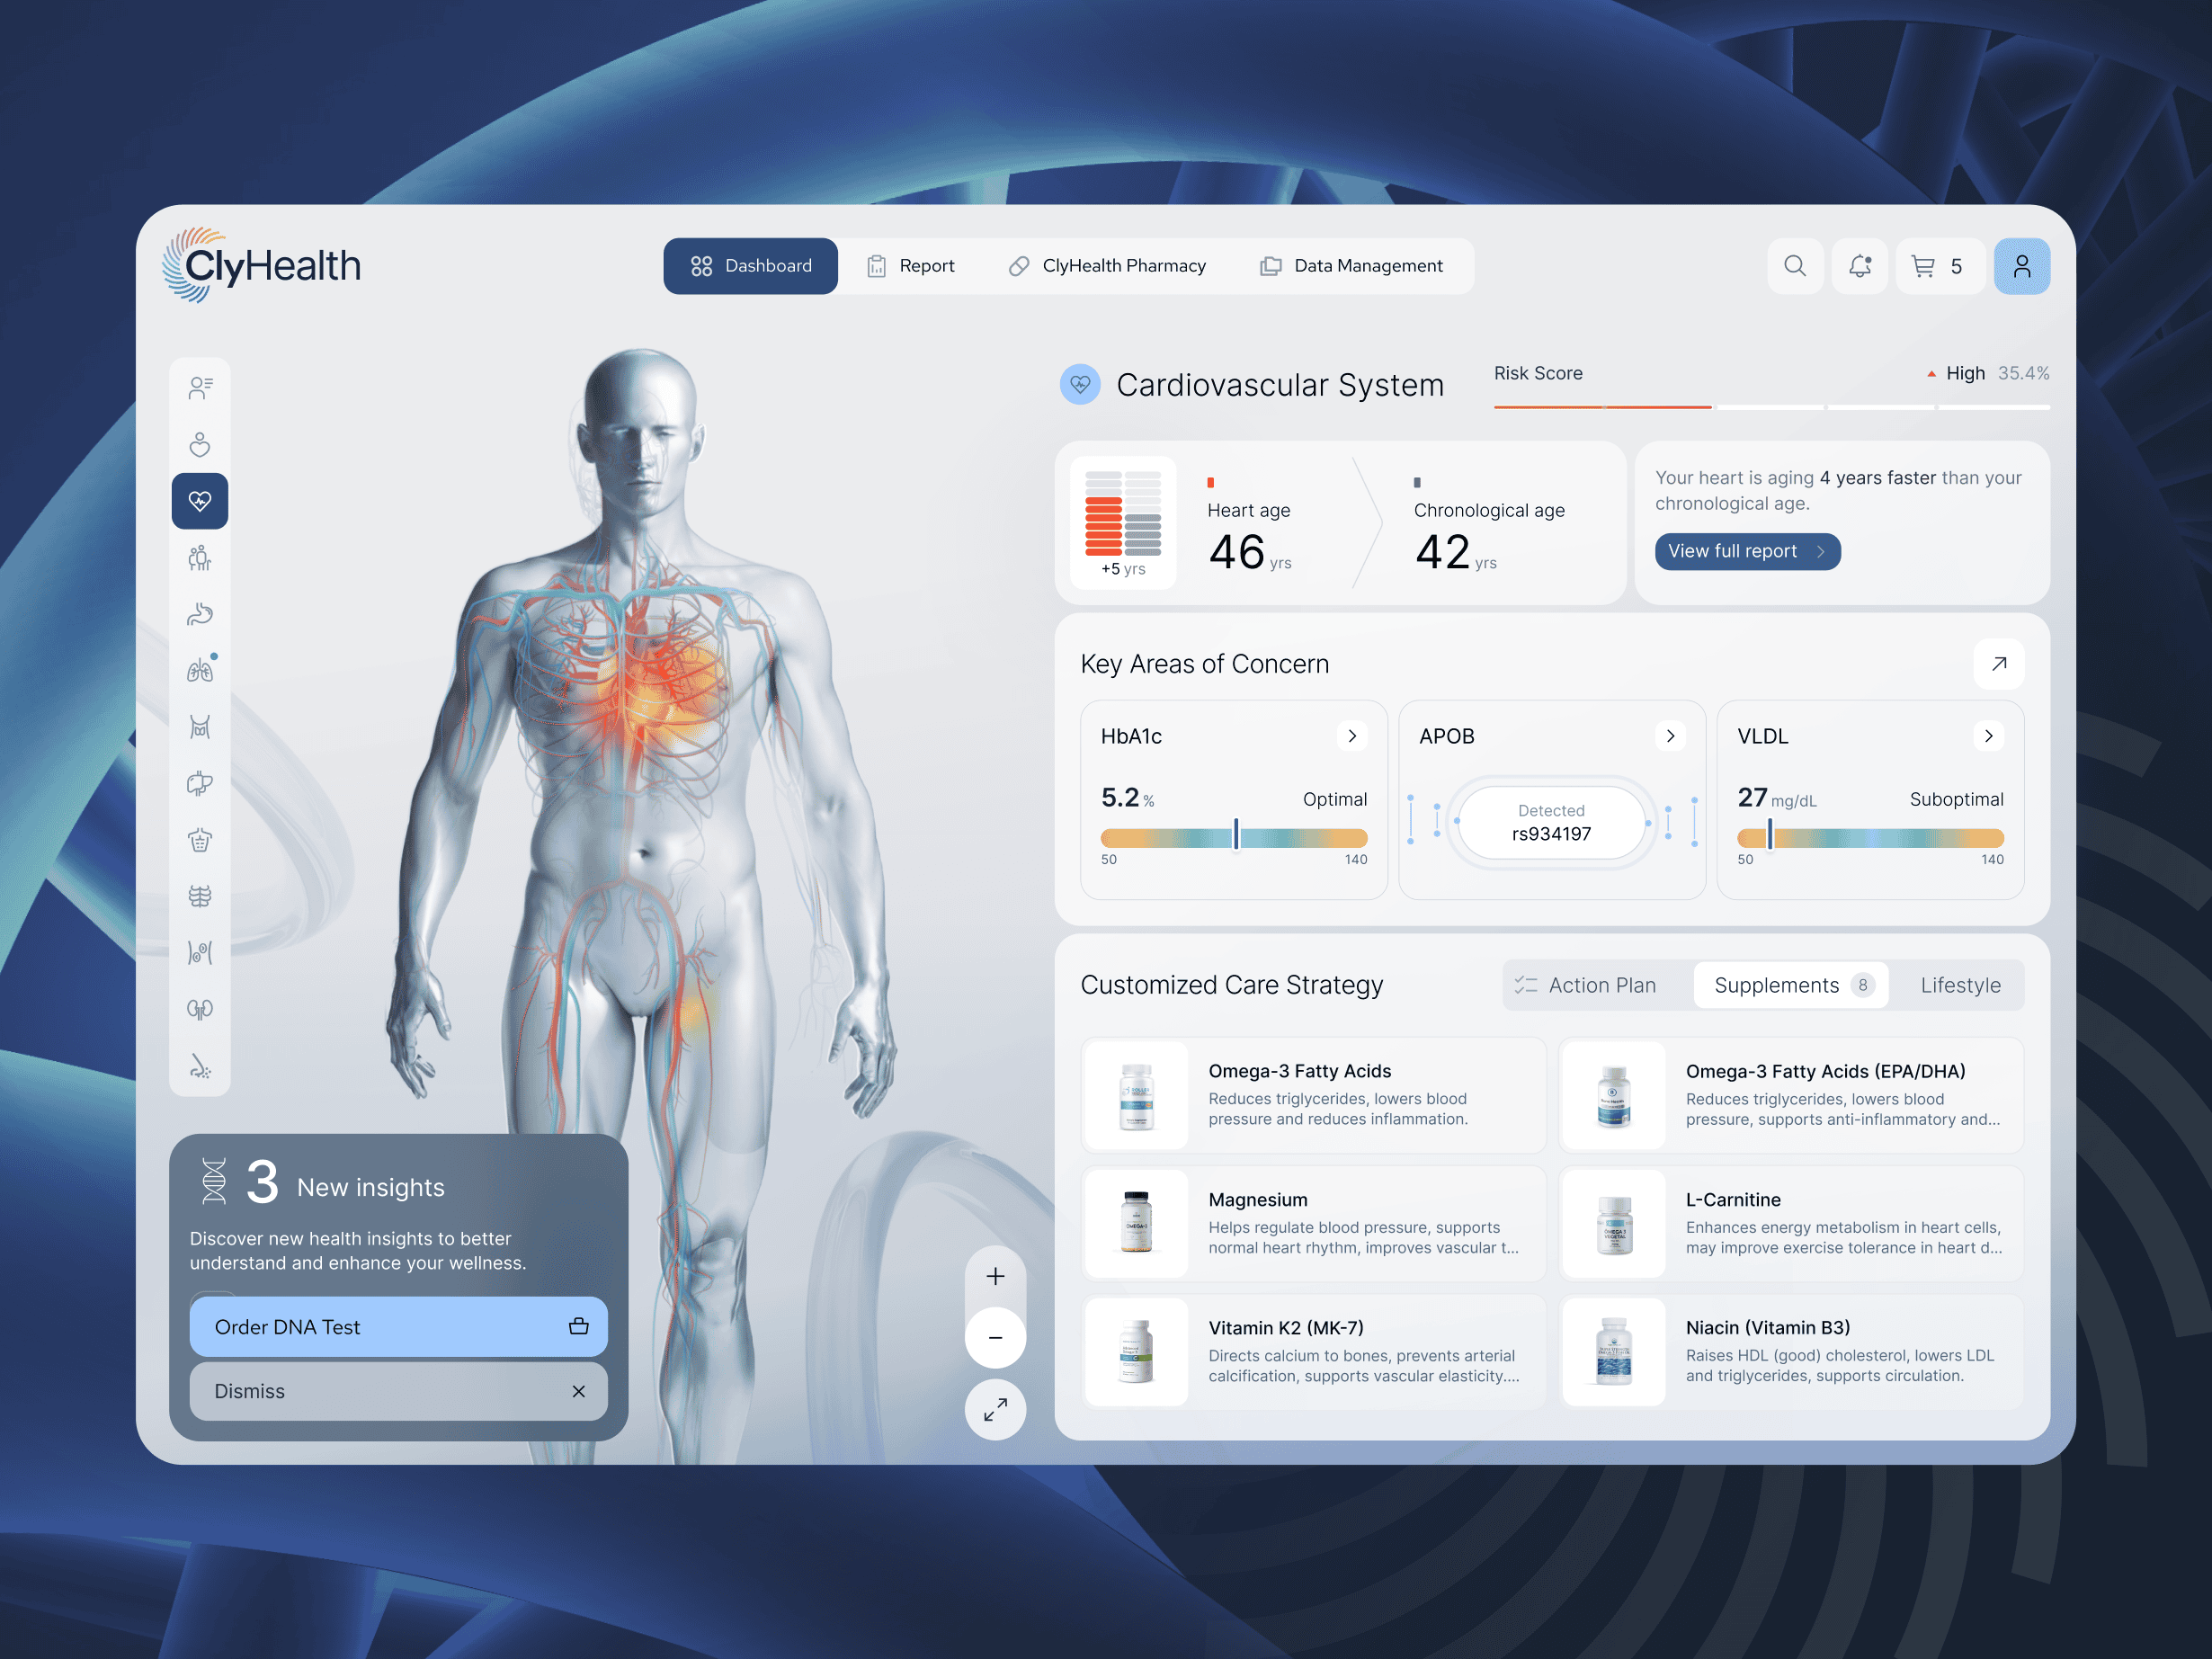
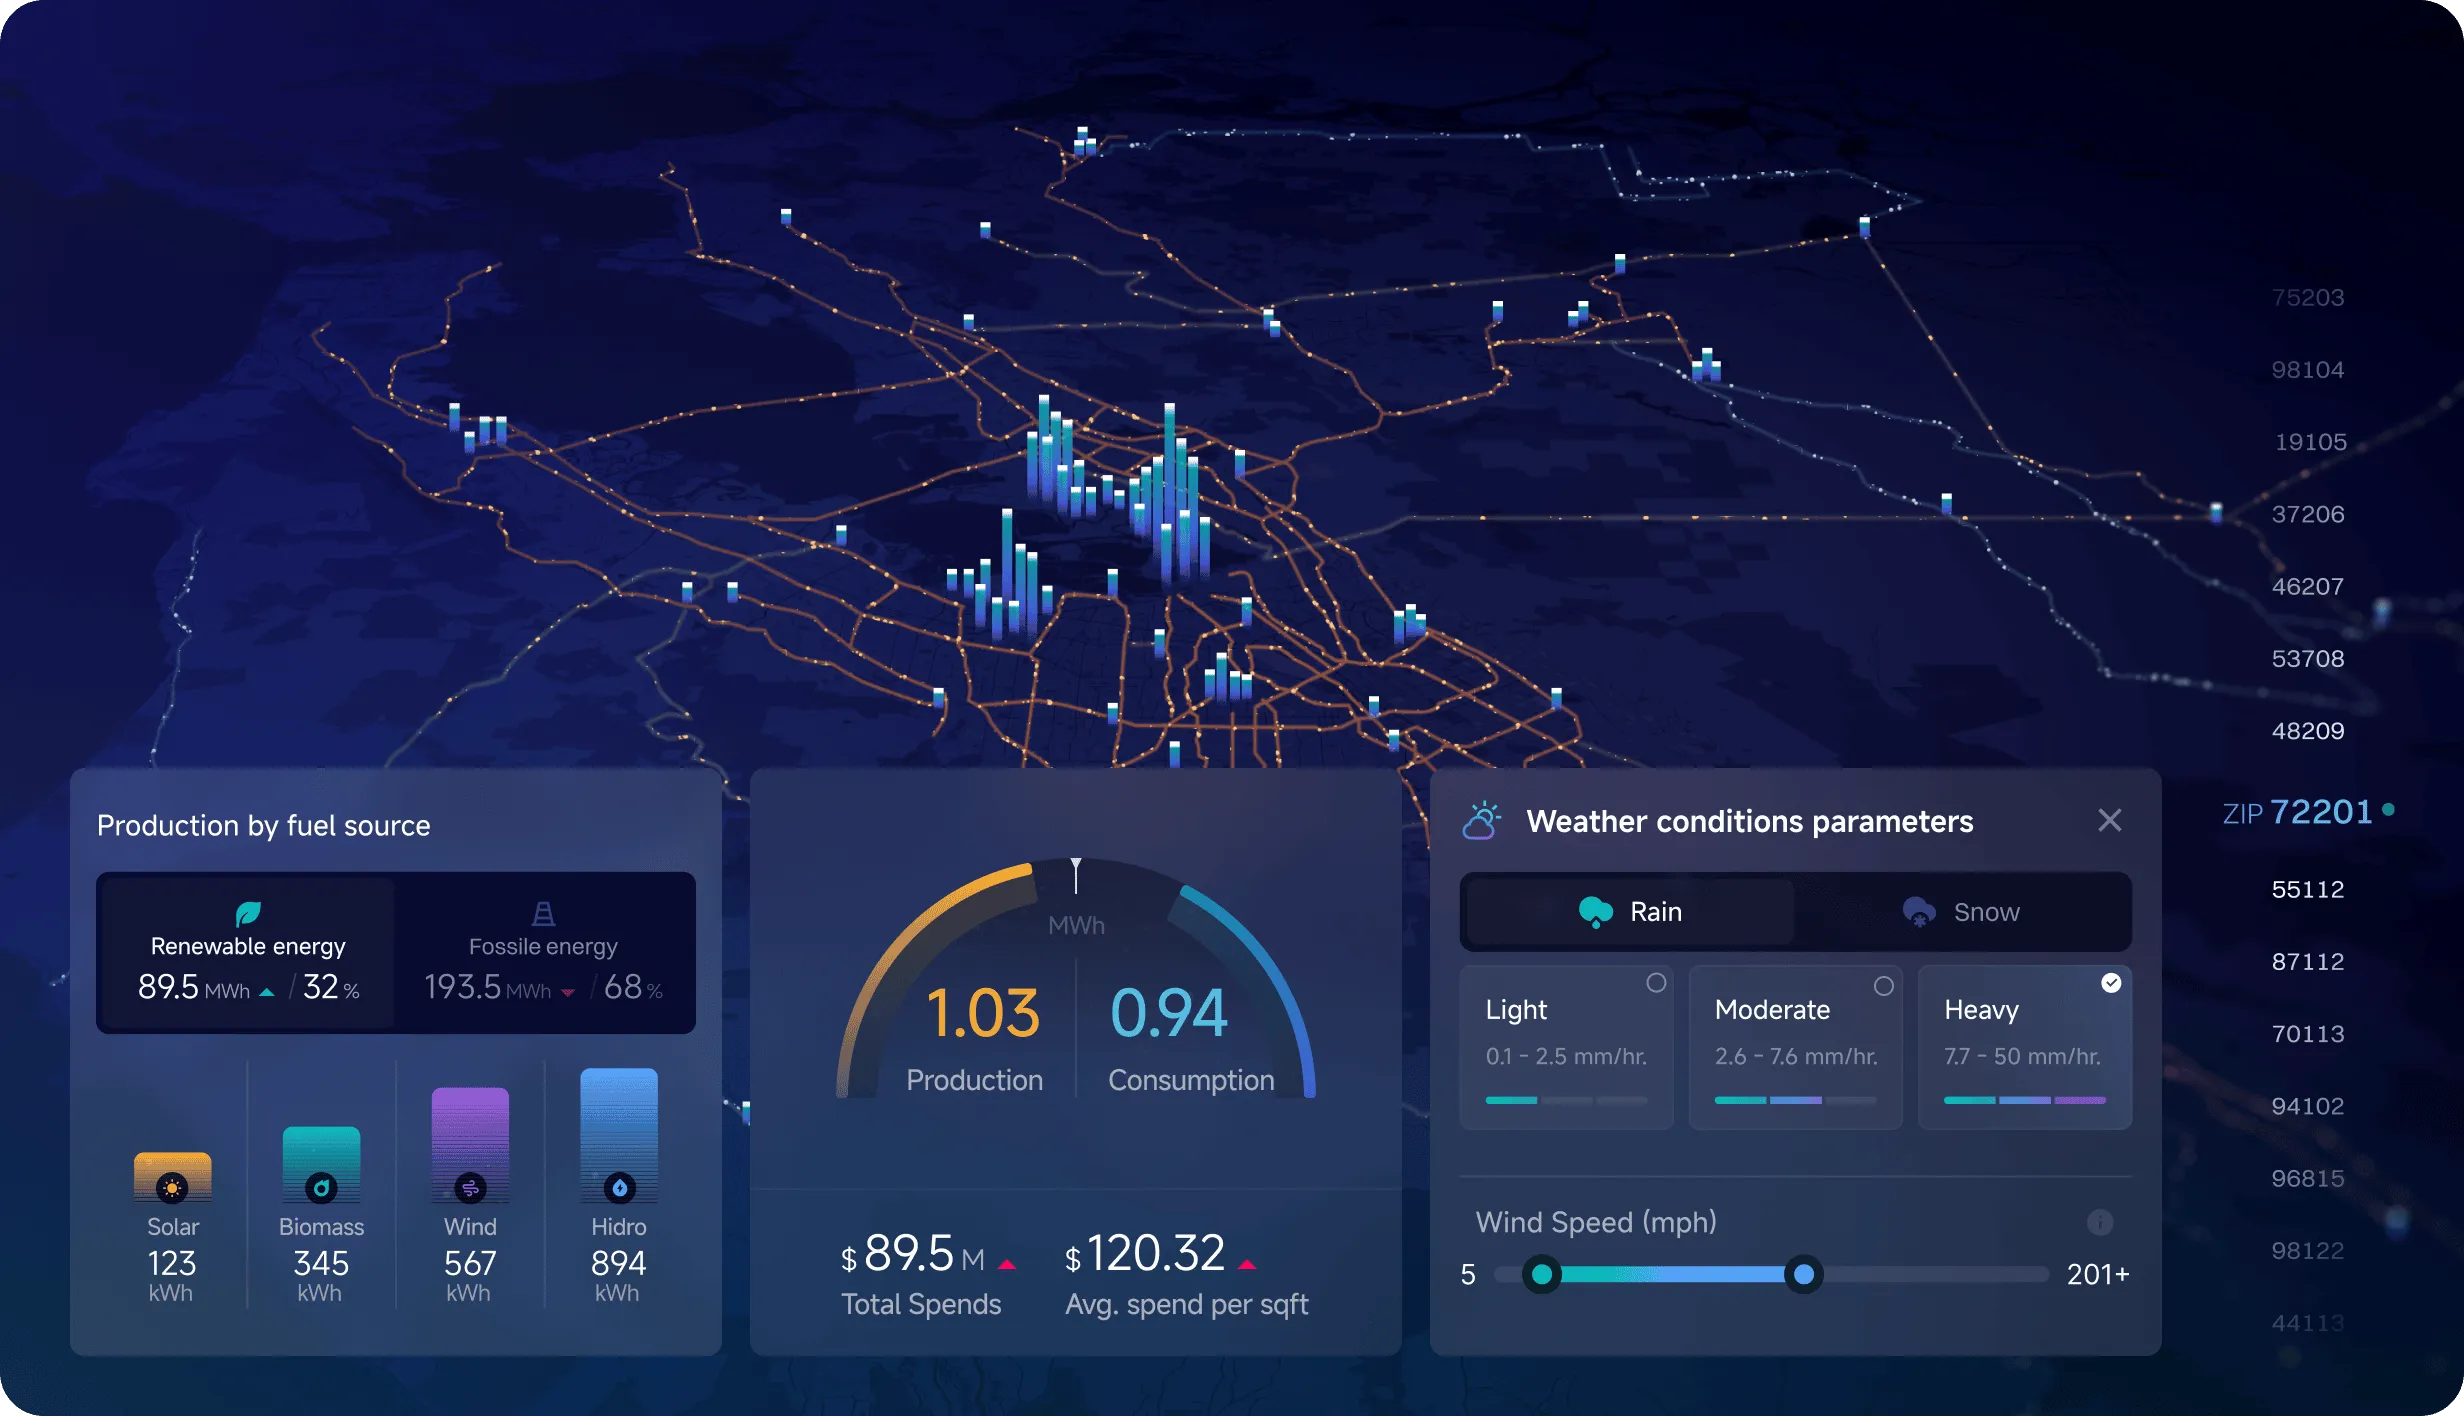
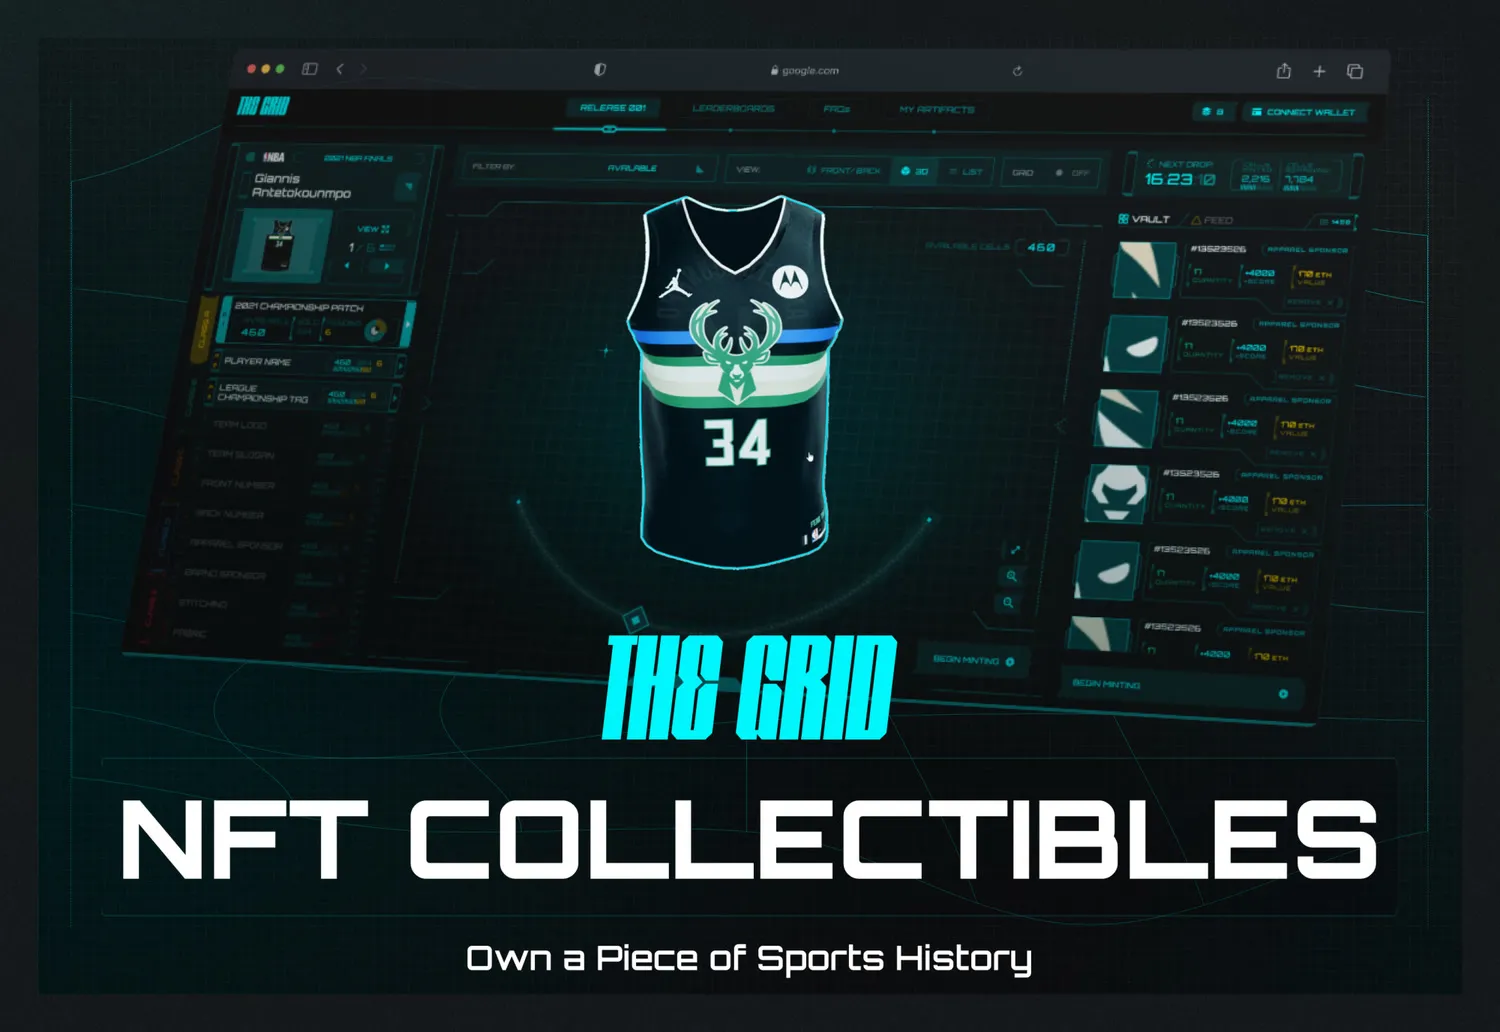
By integrating 2D graphics, 3D video, high-contrast color schemes, and advanced data visualization strategies, this dashboard interface delivers an engaging and dynamic user experience. Grid.ai, a leader in machine learning, required the interface for their inaugural platform to perform at the highest level. The result is a streamlined display that provides everything necessary to manage massive datasets and view specific results with speed, clarity, and precision.
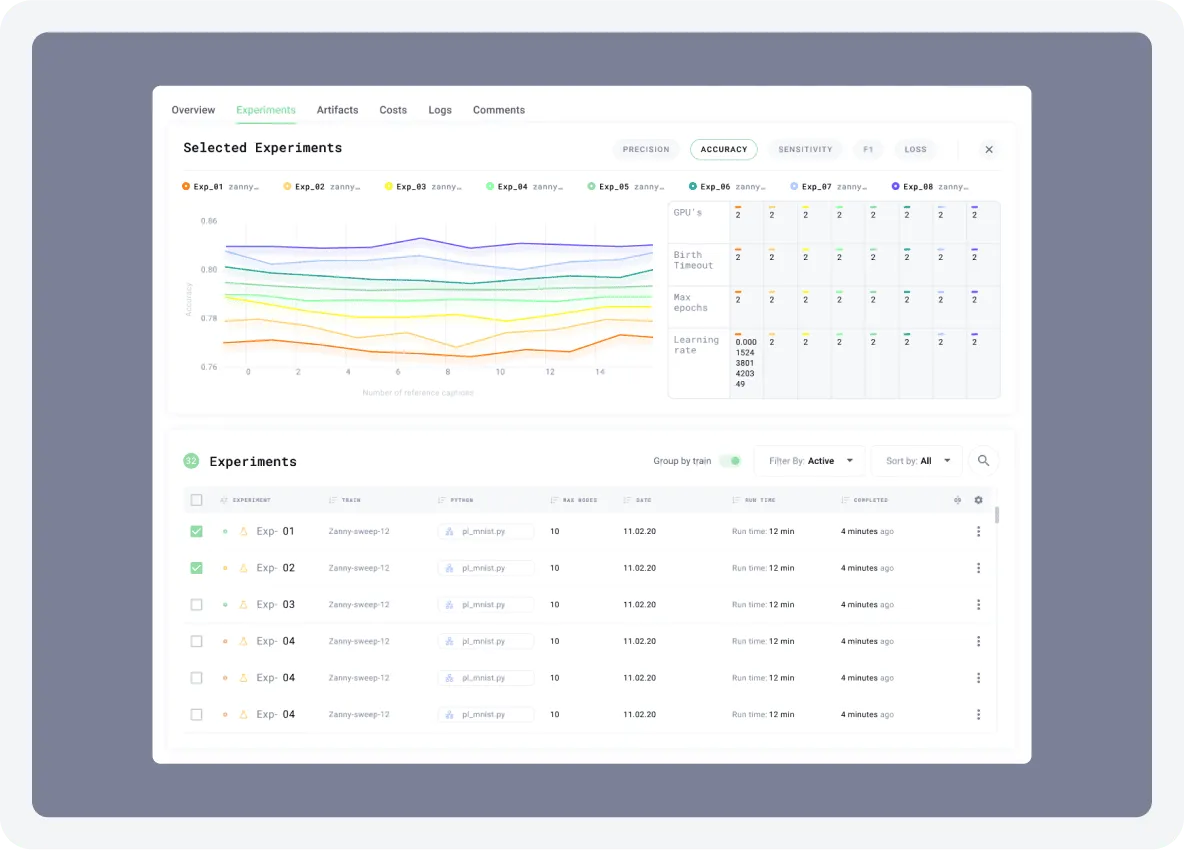
Data Overview
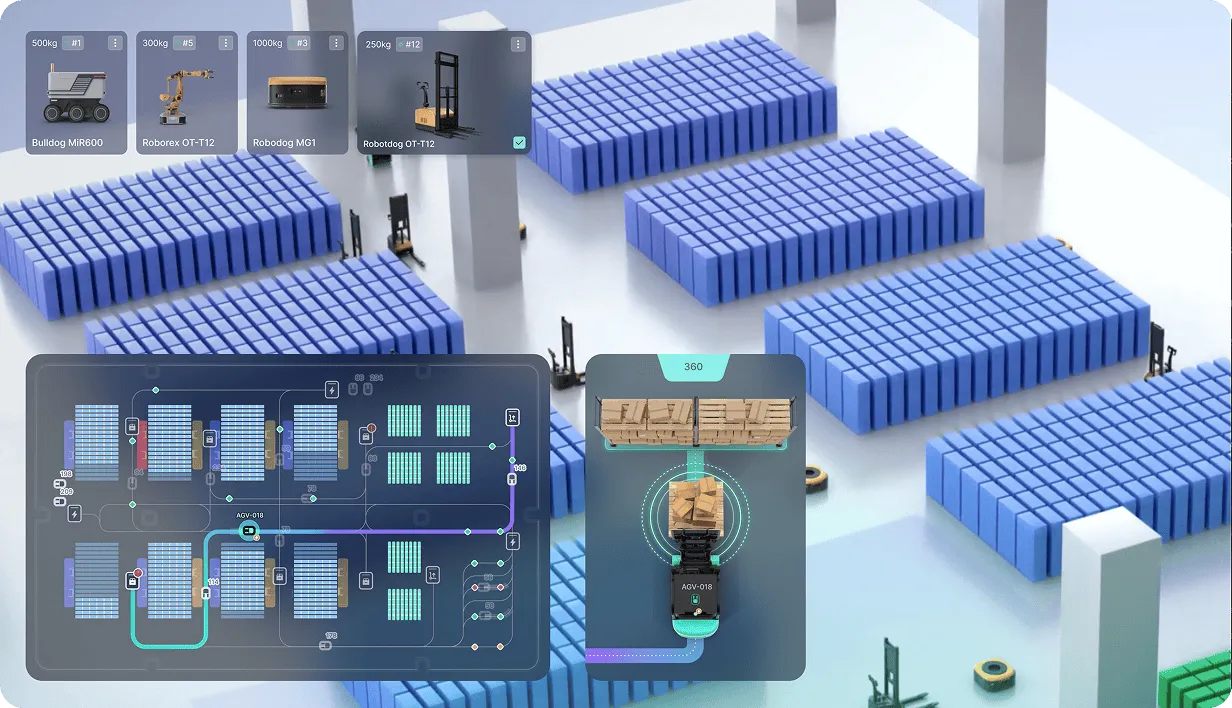
This design makes it effortless to absorb a wealth of information at once—and that’s where its beauty lies. Despite the significant volume of data being communicated, the interface remains clean, balanced, and uncluttered.
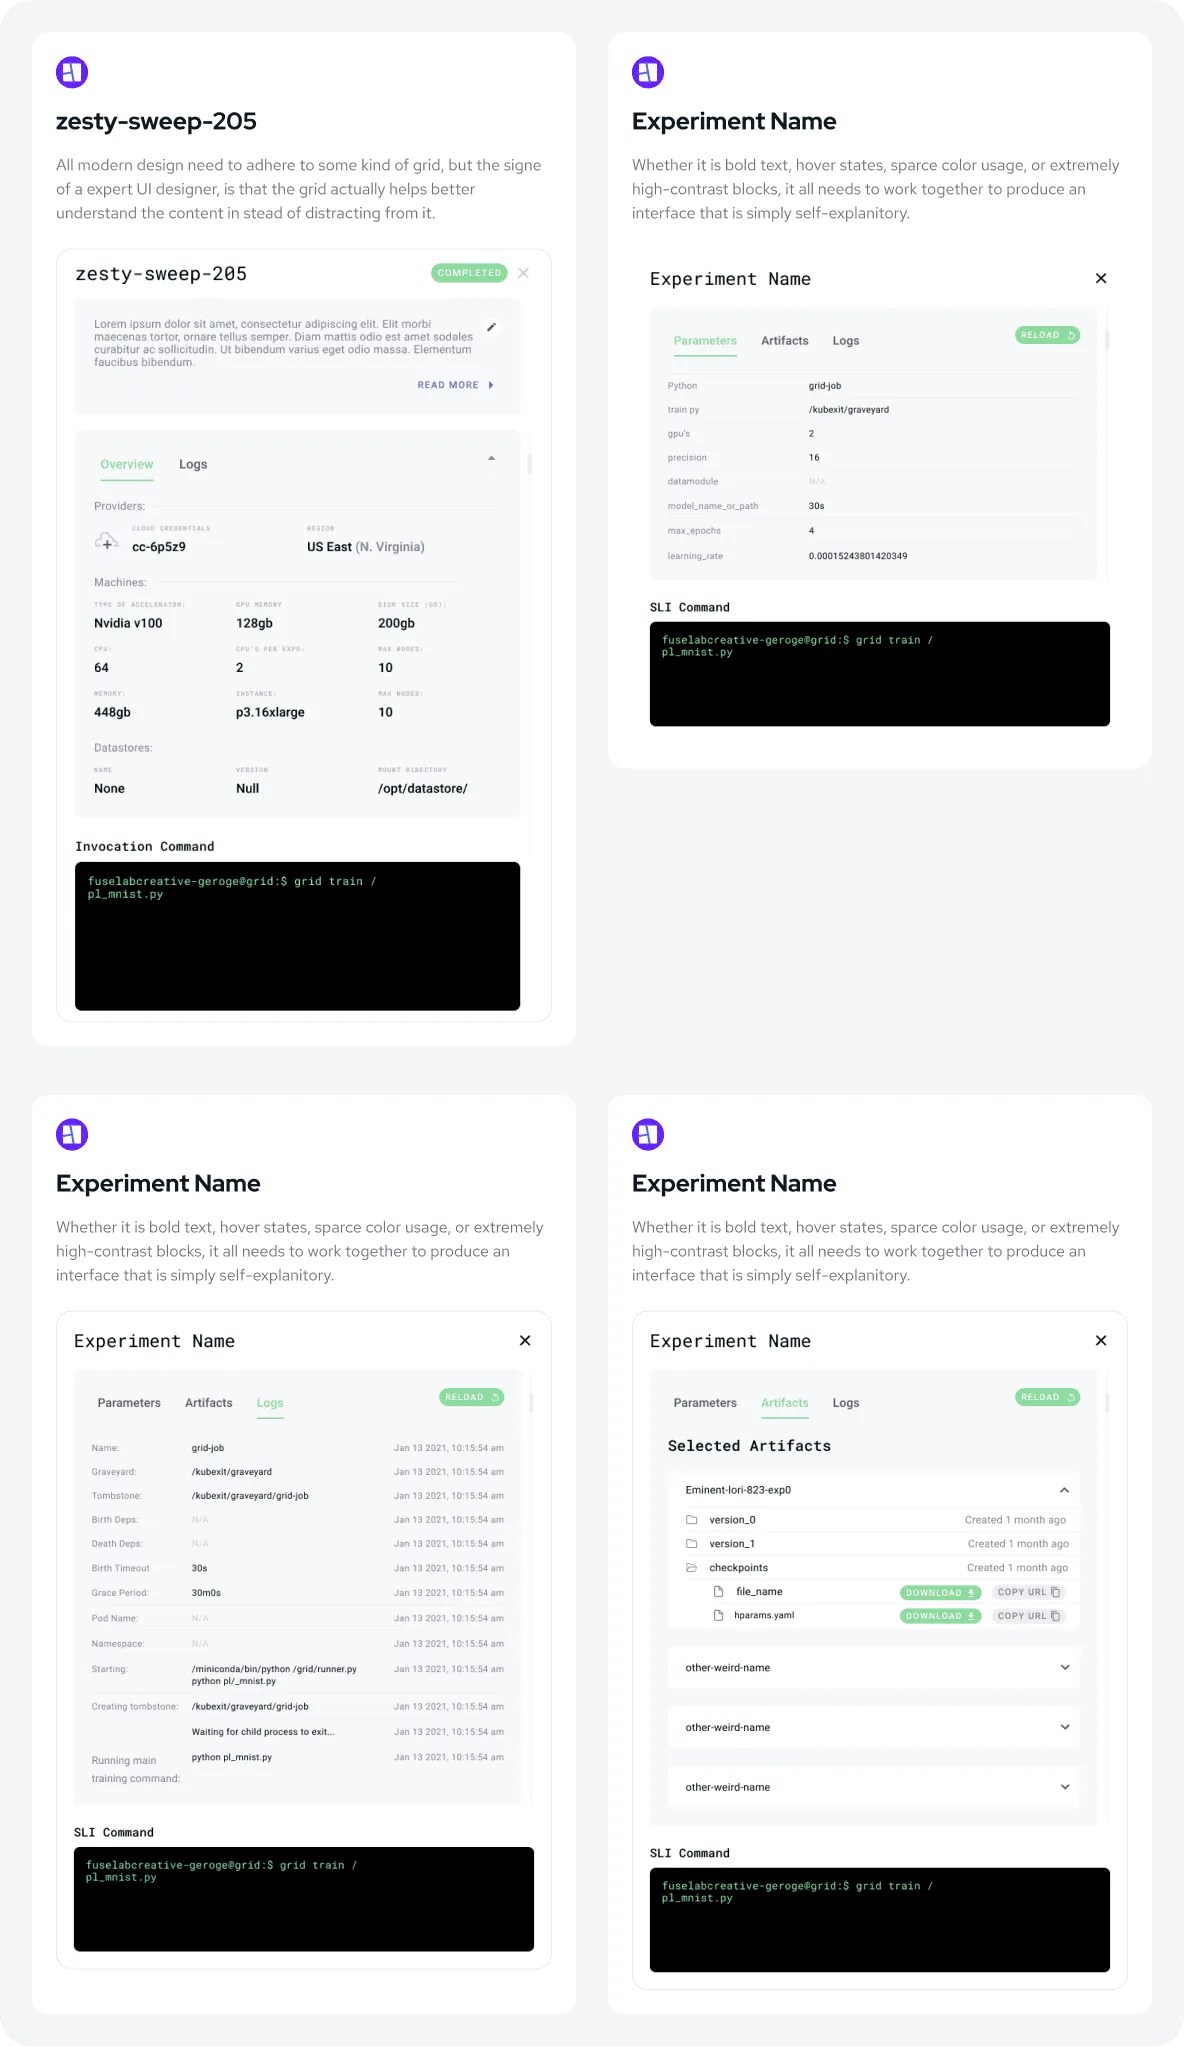
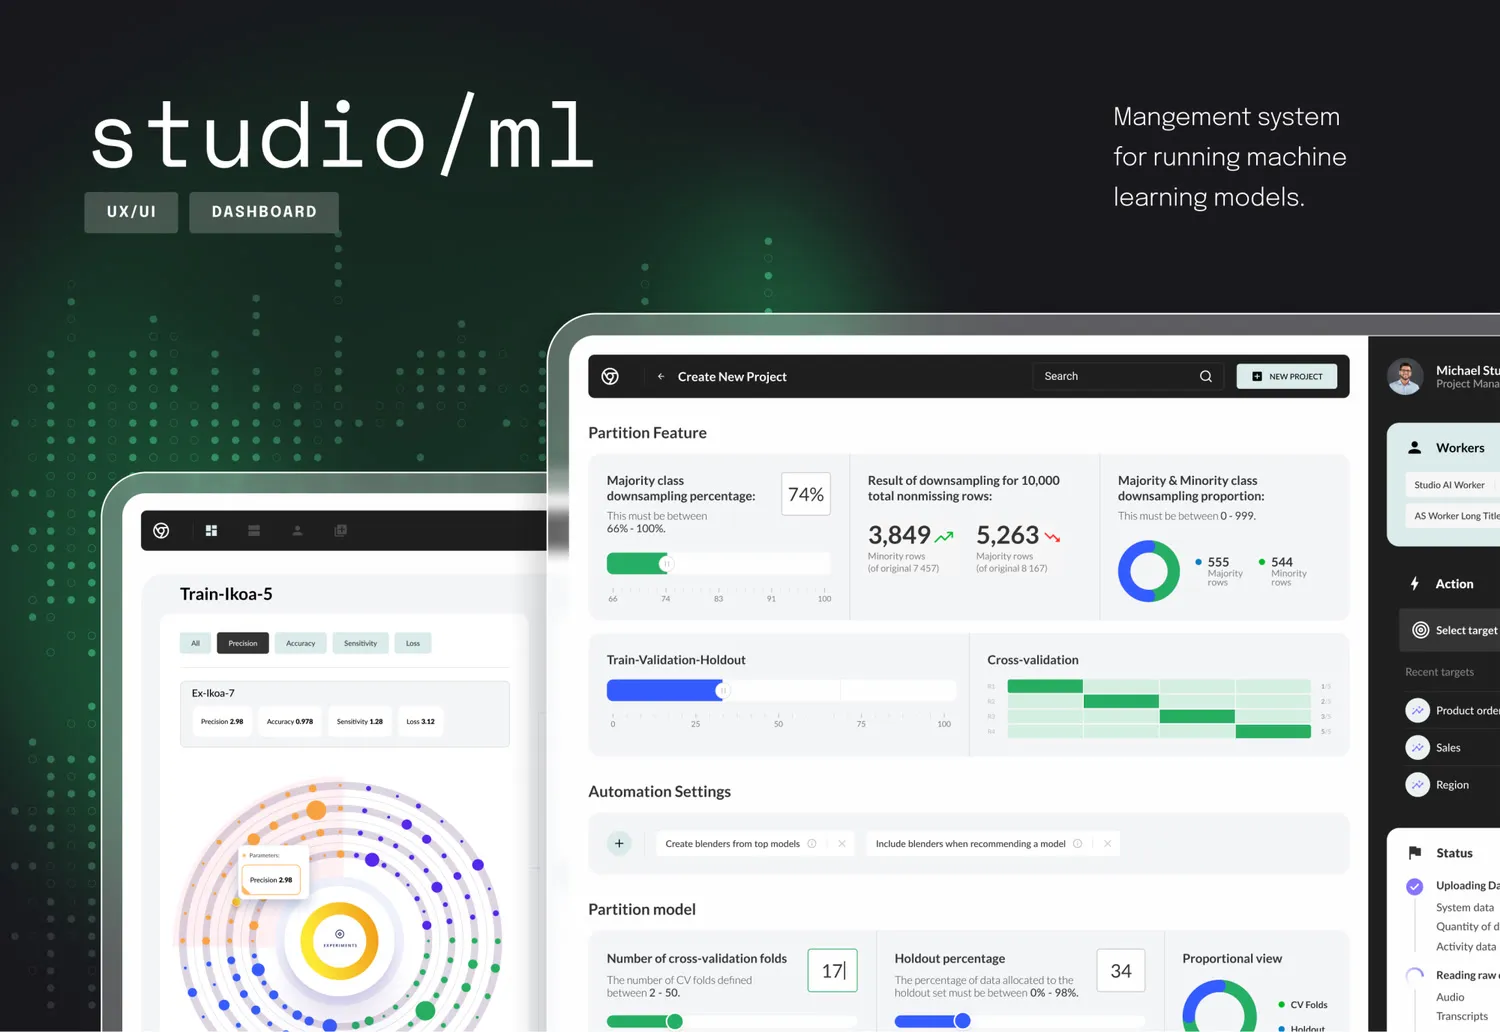
Experiments
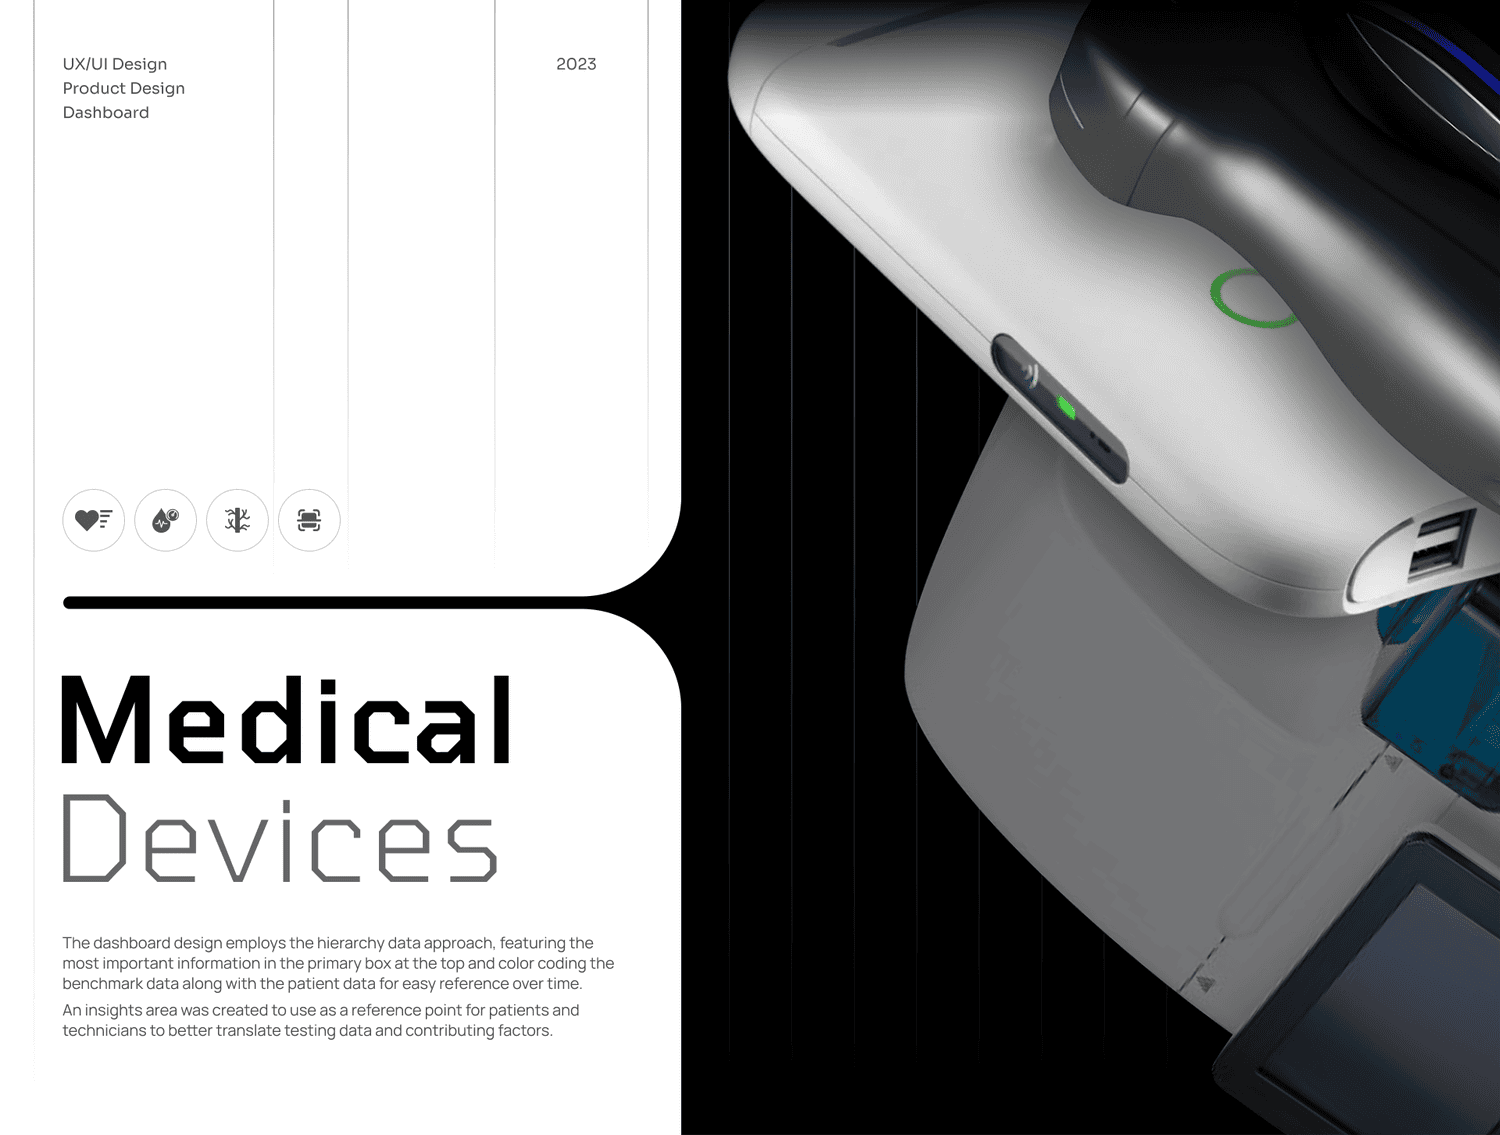
The core of this approach to the interface lies in maintaining a consistent navigation structure, while the display area dynamically adapts based on the user’s selections.
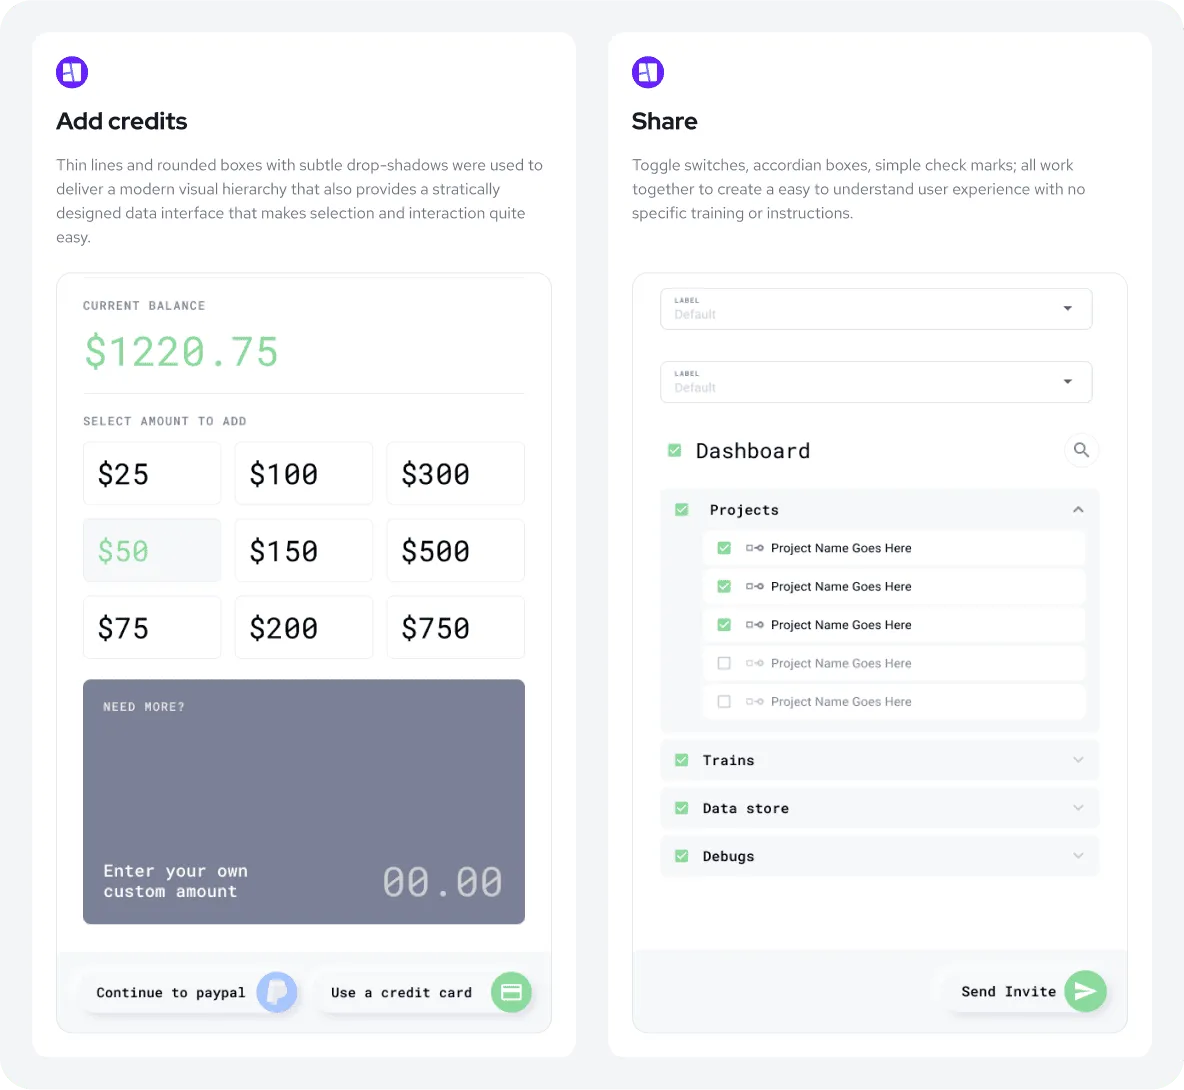
All metrics consolidated in one place
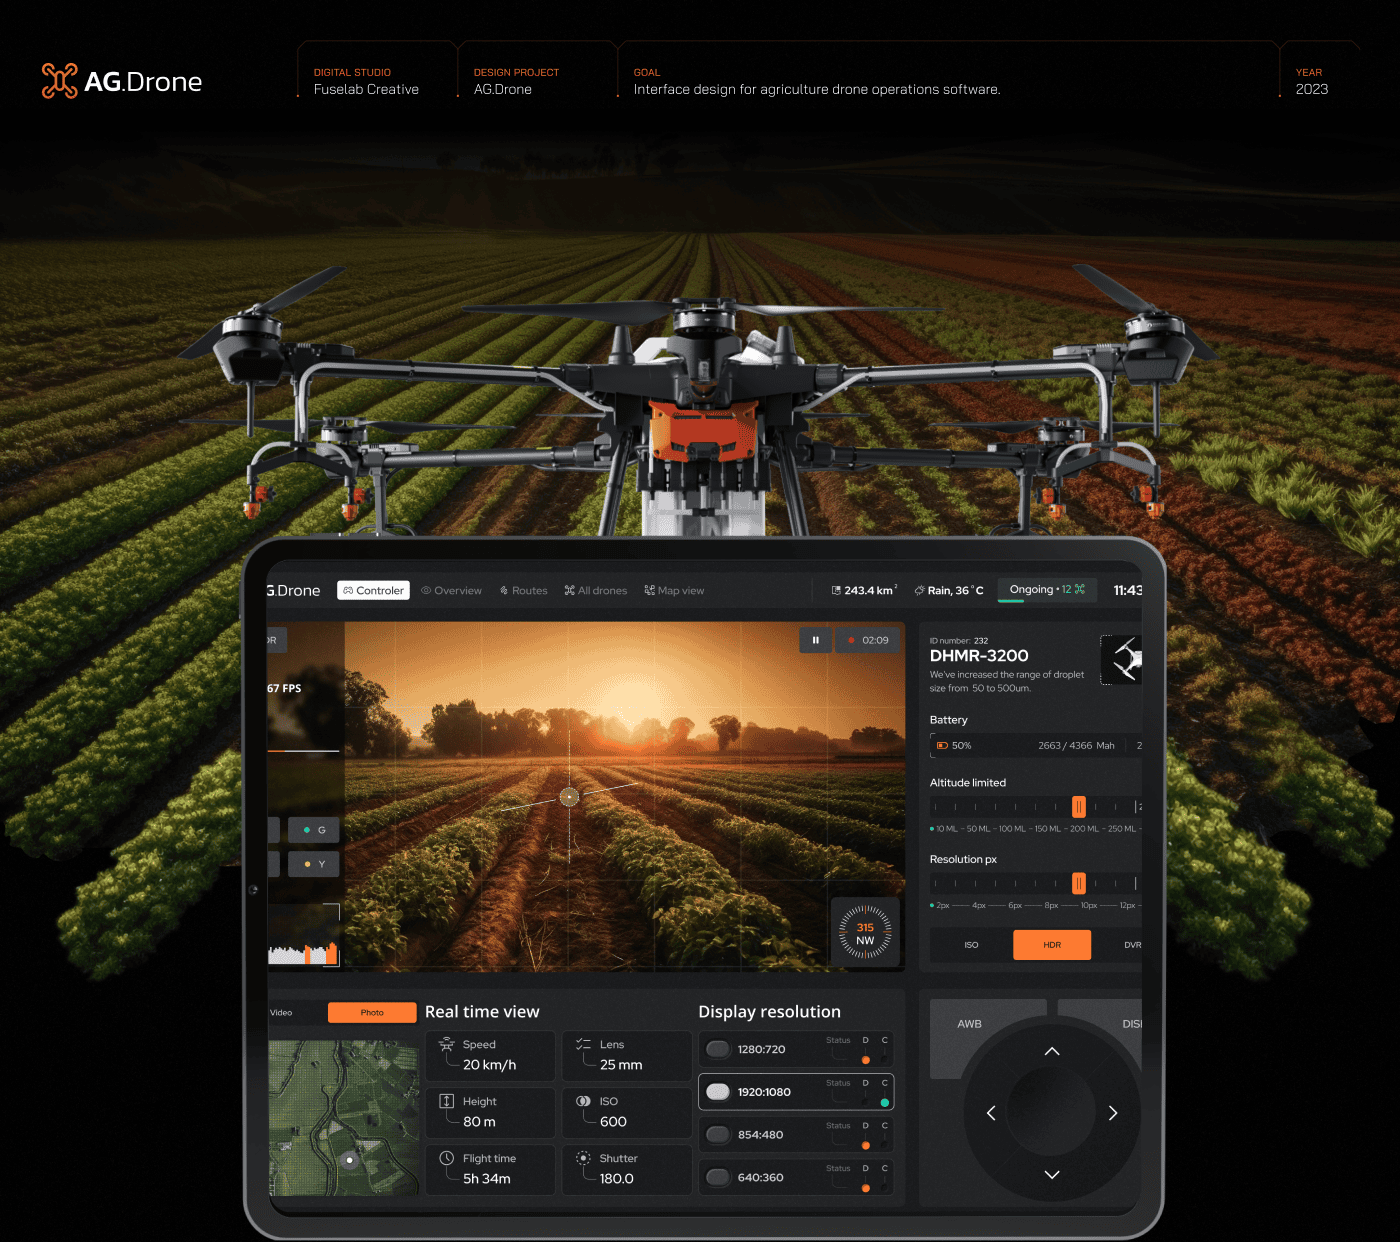
Presenting results in multiple formats enables users to gain deeper insights and refine future experiments more effectively.

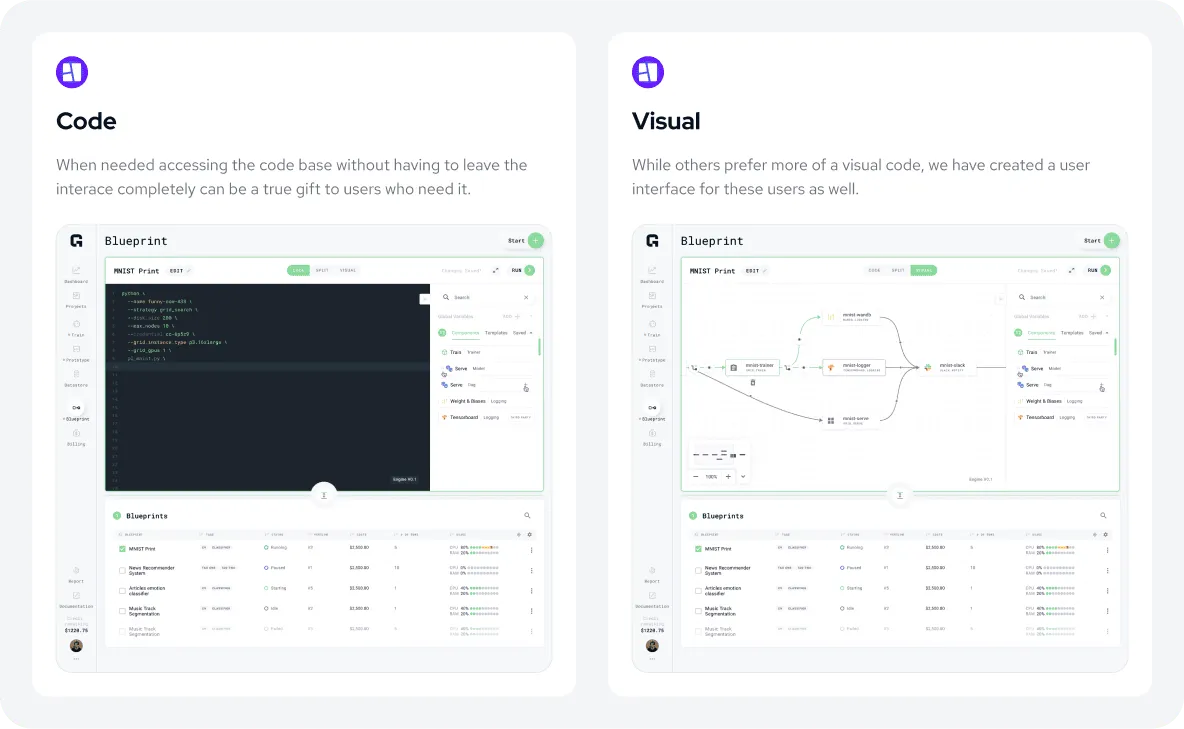
Code | split | visual
There are situations where direct access to raw code is essential, and our approach always ensures space for it.