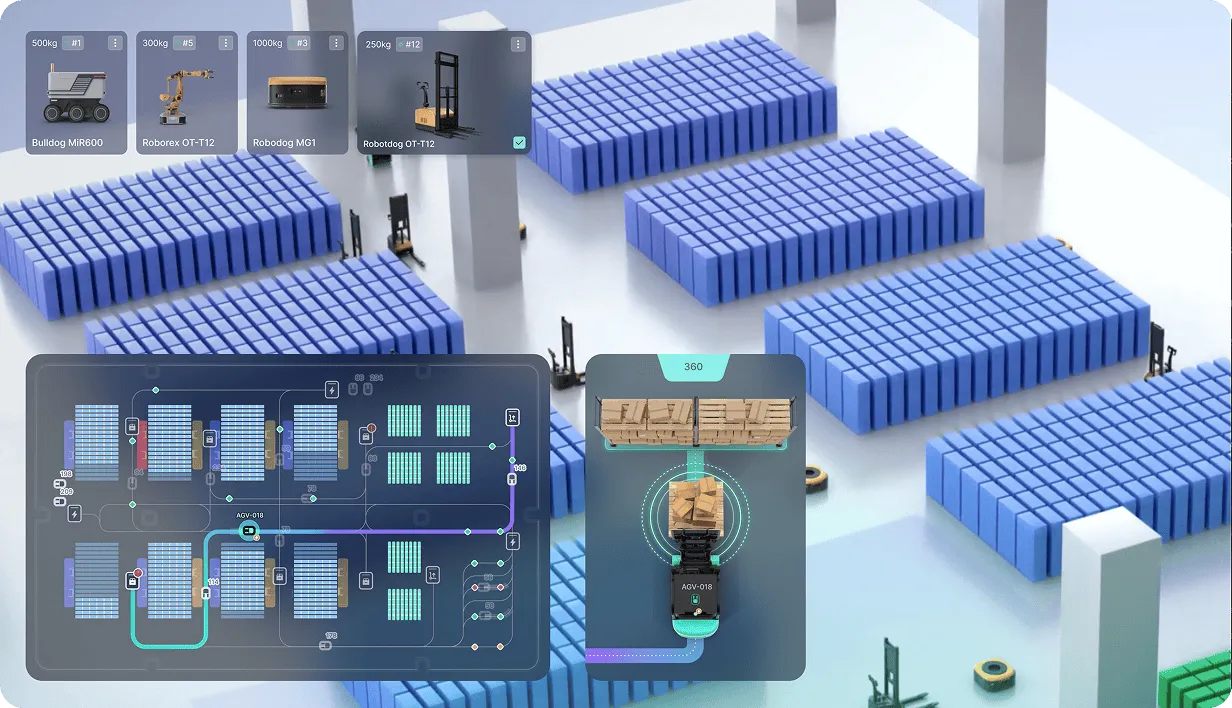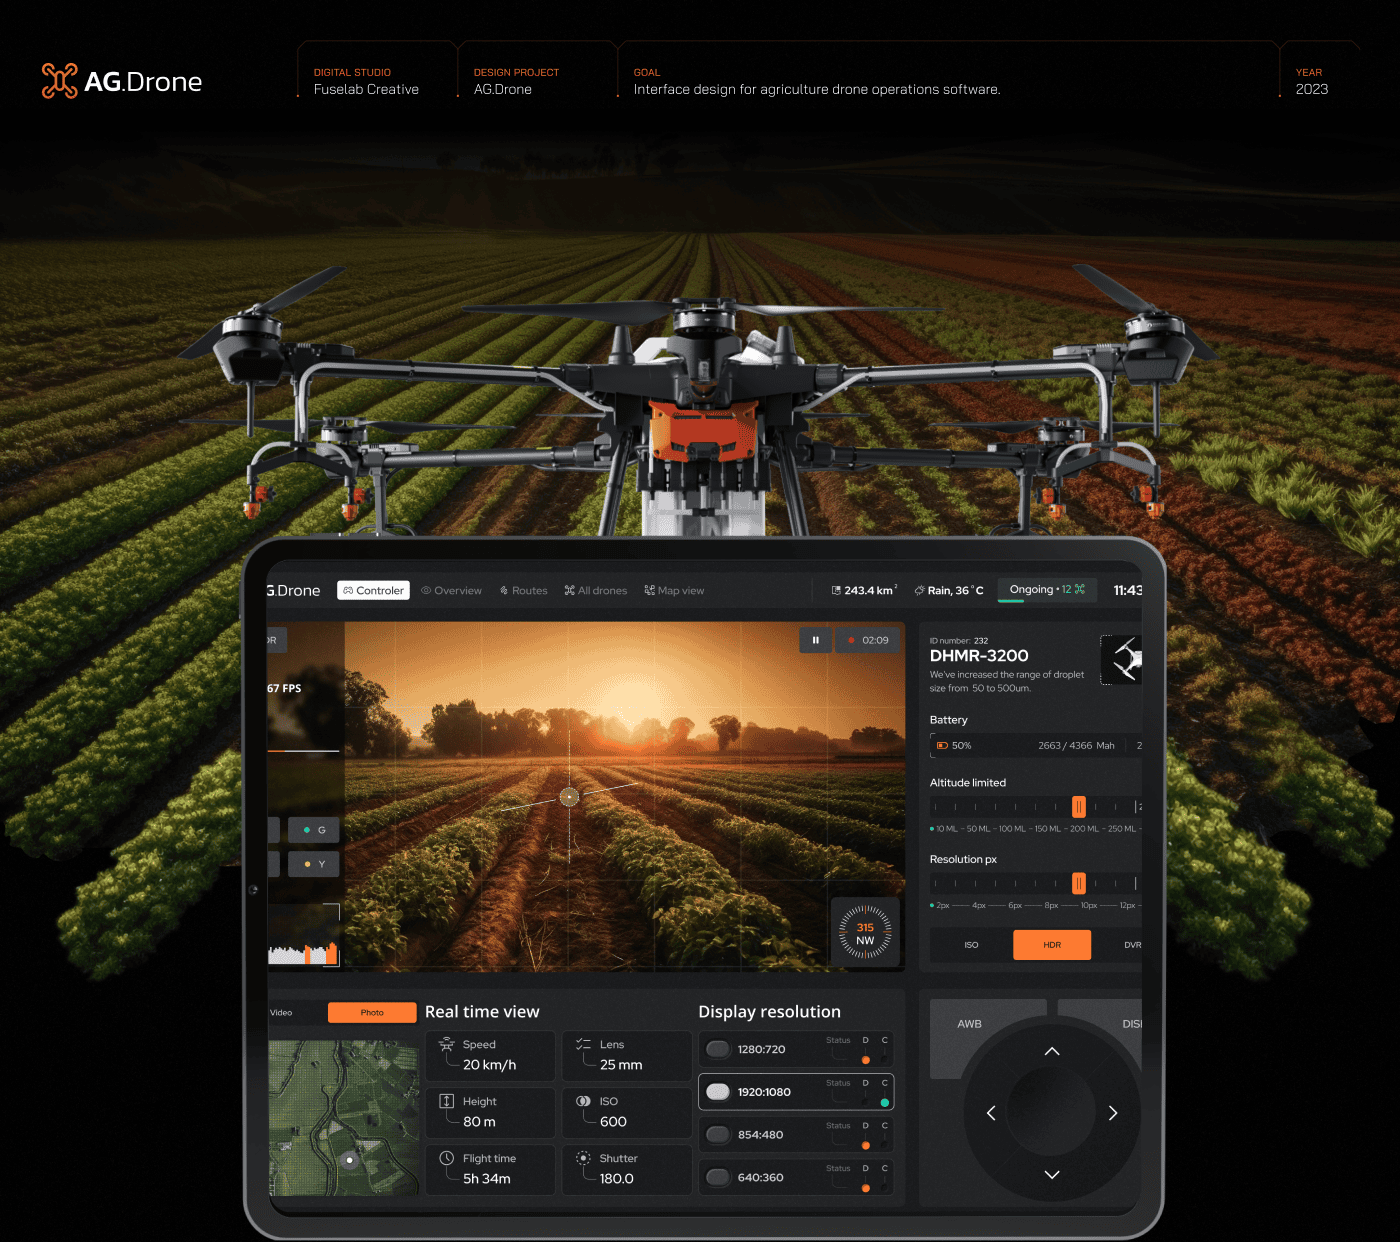
Hyperfab is a native application built for industrial robotics environments. Operators interact with it through augmented reality goggles on the factory floor and a desktop dashboard for planning and monitoring. Fuselab’s scope covered UX research, UI/UX design, and animation for the existing product. All designs have been implemented and are actively used in commercial construction environments today.
Factory Performance Overview
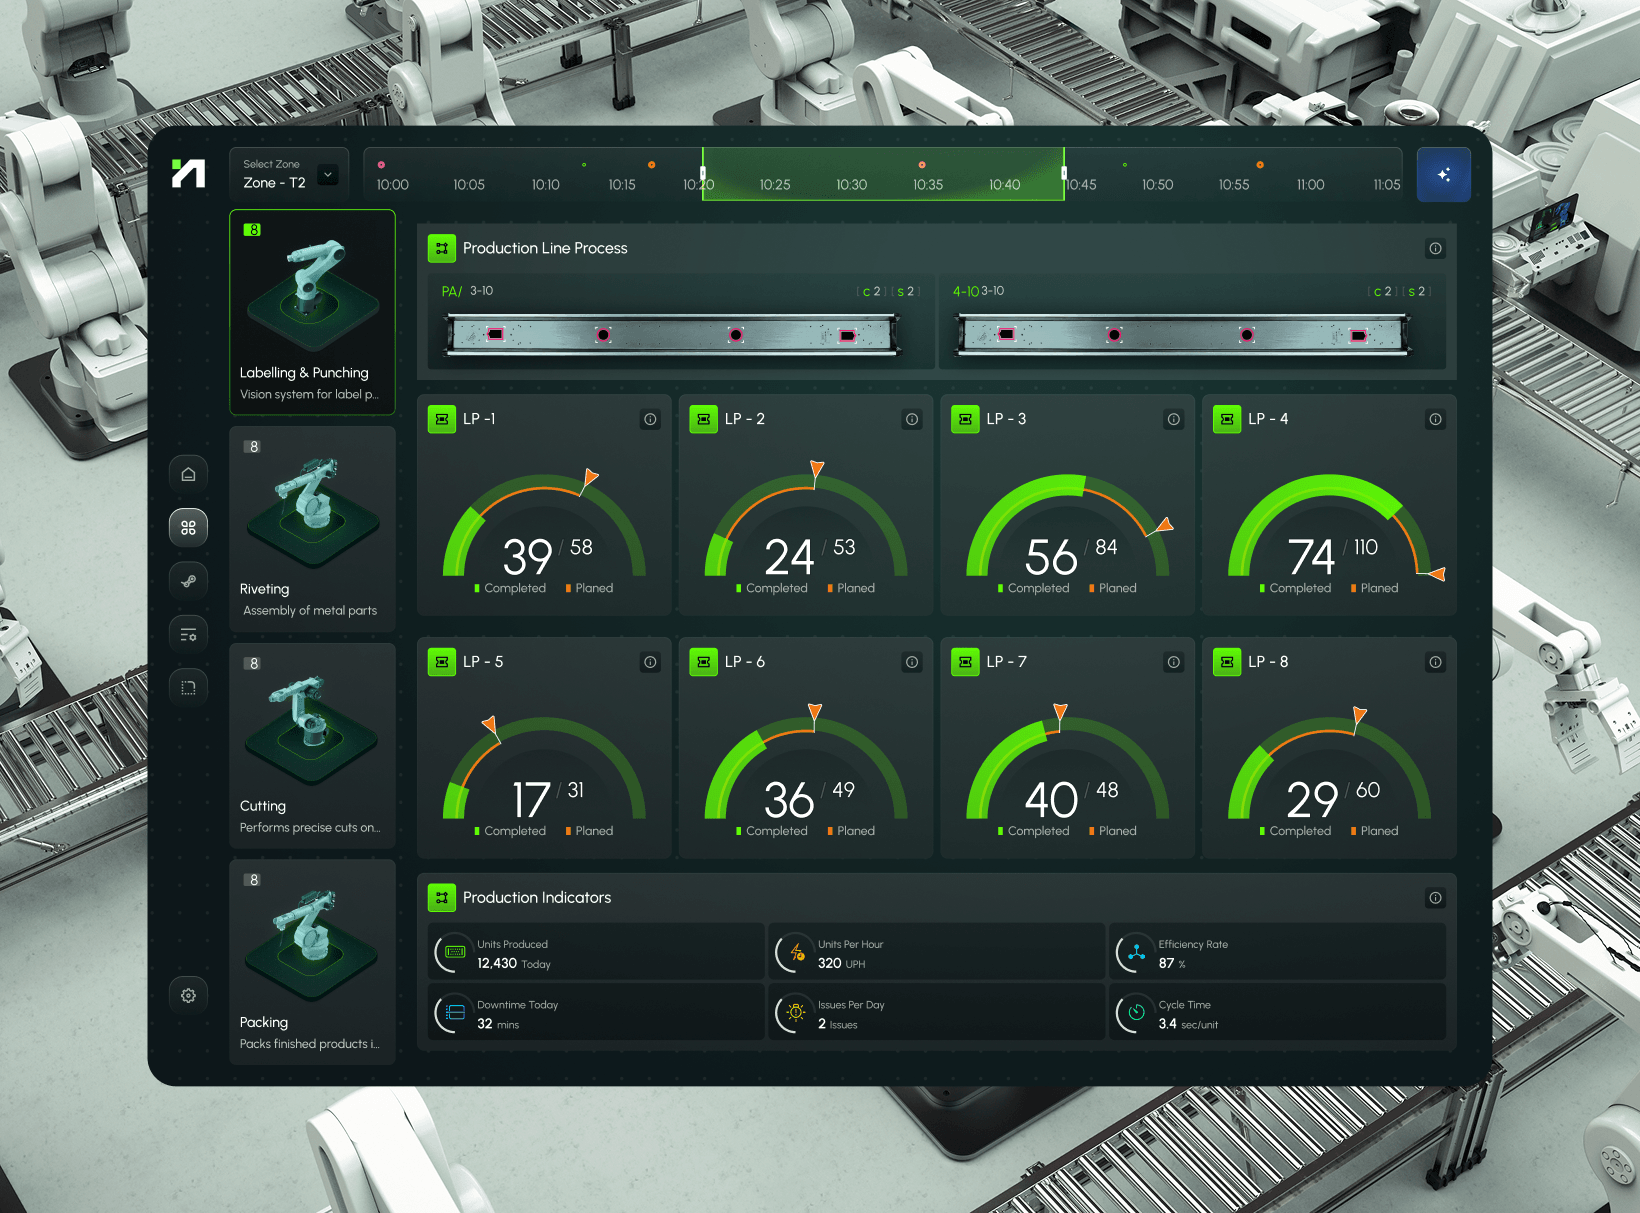
Factory interfaces operate in an environment where a misread status indicator can stop a production line. Hyperfab’s dashboard uses color coding that follows universal industrial conventions: green for normal operation, yellow for warning states, red for critical alerts. Typography is sized for readability at distance and under variable lighting conditions. Information is grouped by operational function rather than data type, so operators can locate what they need at a glance without reading through unrelated metrics. These are not aesthetic decisions. They are functional requirements for an interface that runs on a live production floor.
Planning & Real-Time Production Planning Against Target Output
The planning layer of Hyperfab shows actual production numbers against planned targets in real time. When output falls behind schedule, the interface surfaces the gap immediately so production managers can intervene before a delay compounds. Tracking actual versus planned performance continuously, rather than reviewing it at the end of a shift, changes the speed at which problems are identified and addressed.
AI Simulation Interface for Robotic Process Preview
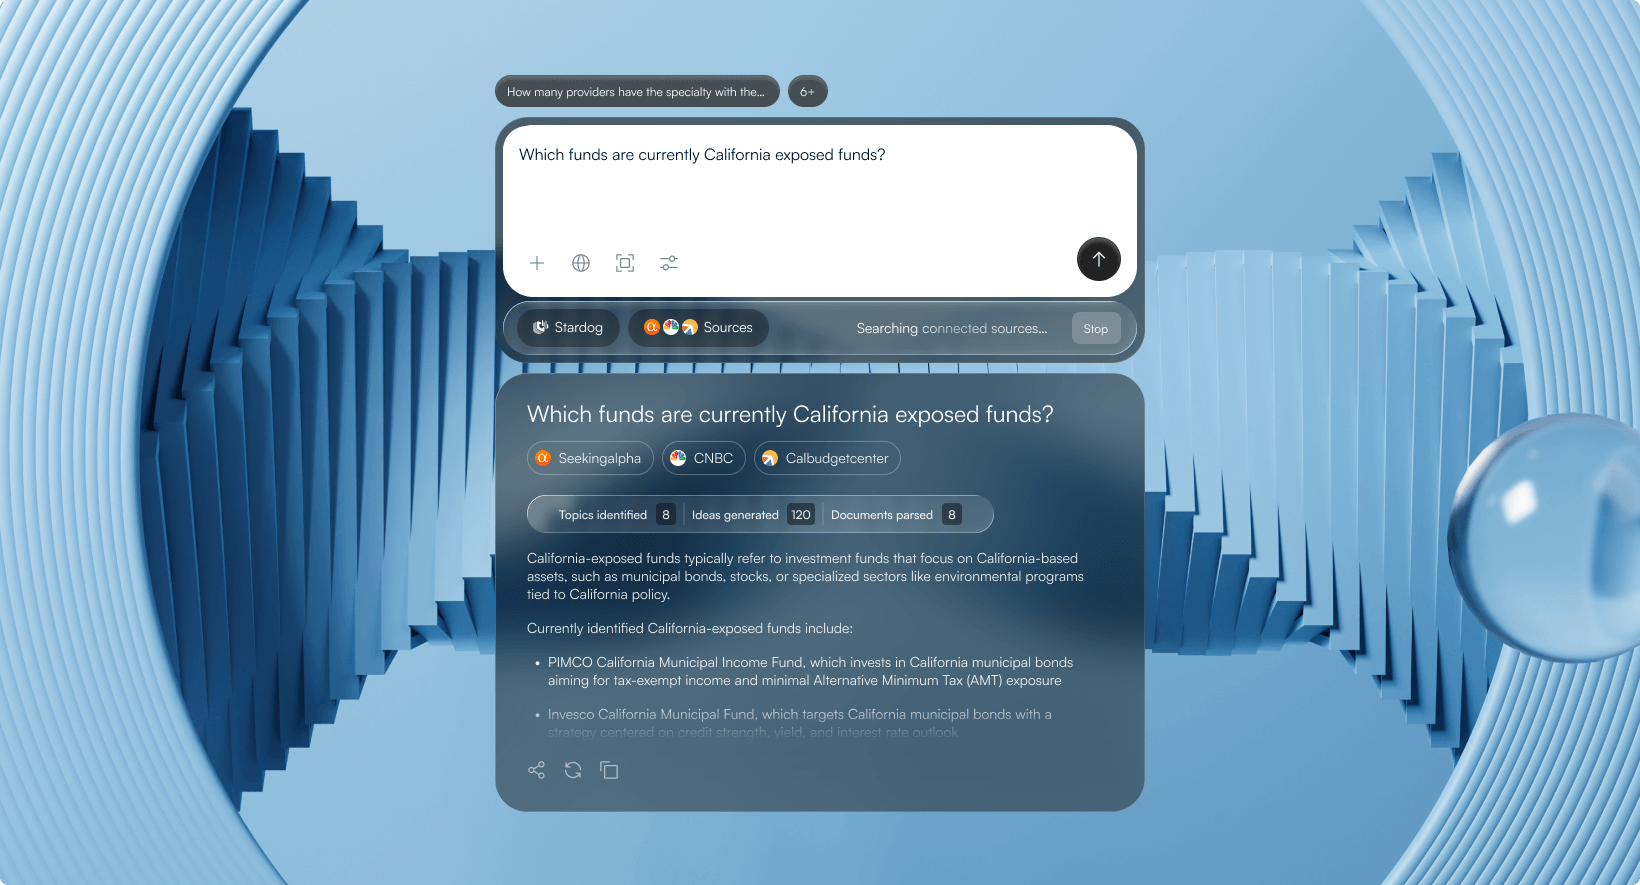
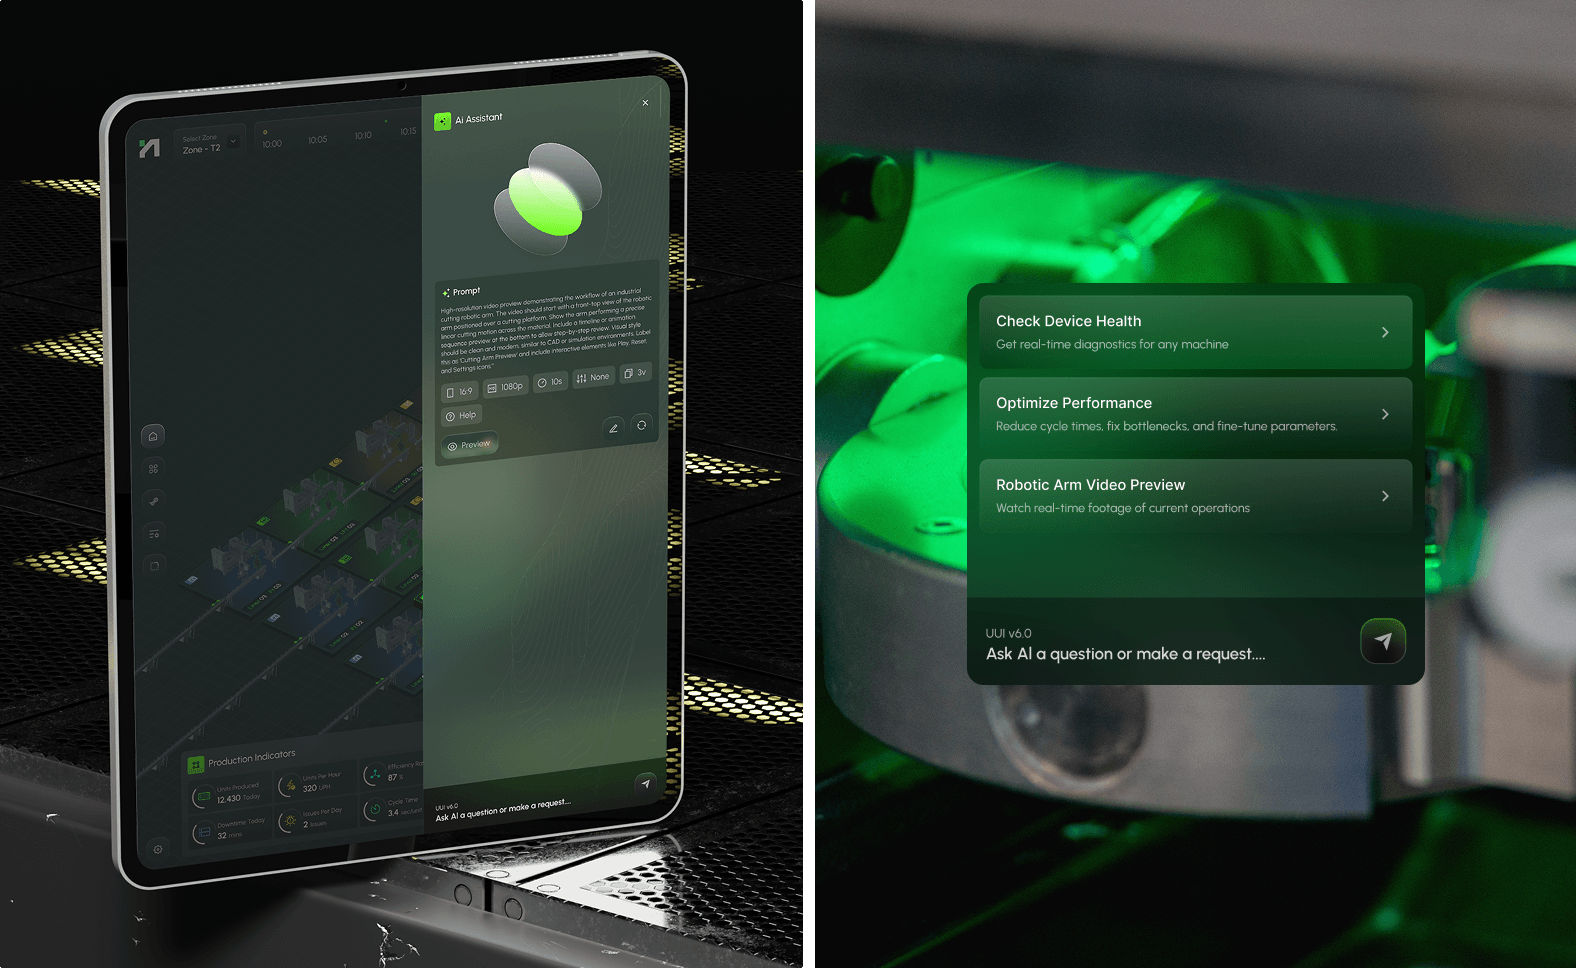
The AI simulation interface allows operators to preview robotic processes before executing them. Using a prompt-based input, users can simulate cutting, labeling, or assembly operations and view a detailed animation of the motion path, including the full arc of a cutting arm, with timeline controls and playback tools. Fuselab designed the animation layer for this feature. The ability to visualize a robotic operation before it runs reduces setup errors and gives operators a way to verify configurations without a physical test run. Fuselab’s experience with simulation interface design informed how this feature was structured for operator use in a live industrial environment.
Robotics Dashboard Design
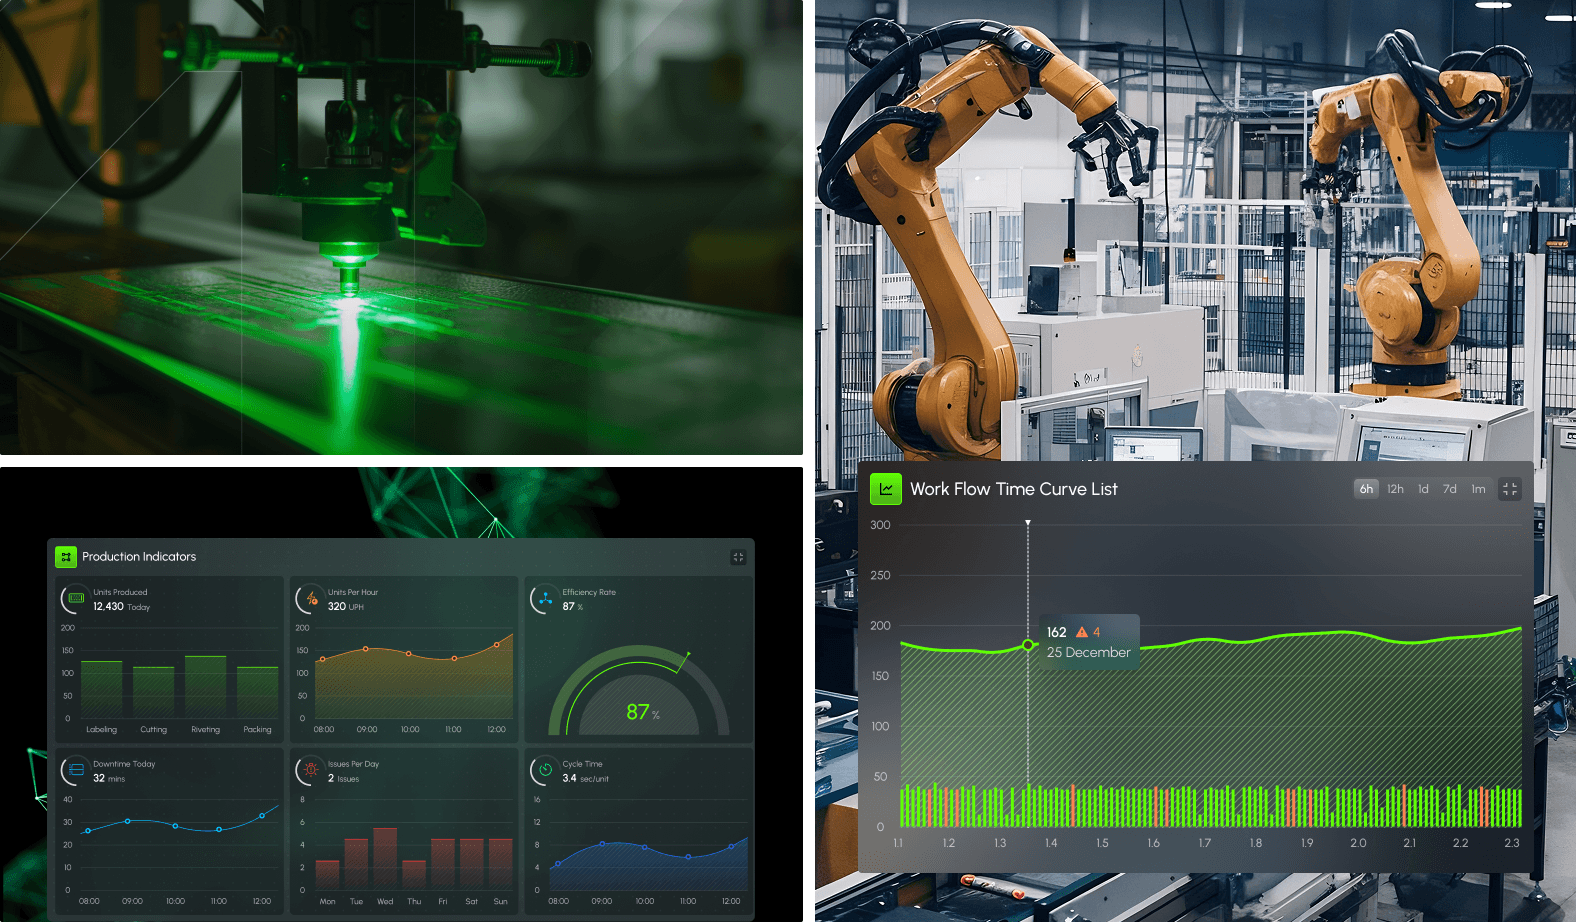
Robotics Dashboard Design for Output Trends & Goal Tracking
Equipment Performance Tracking Across the Production Floor
The equipment tracking layer shows how each robotic unit is performing individually and how the full fleet is performing collectively. Real-time metrics allow direct comparison between actual output and target output at the unit level and at the floor level simultaneously. Historical and monthly trend views give production managers the context to distinguish between a short-term variance and a longer-term performance pattern.
Device Calibration and Real-Time Robotic Control
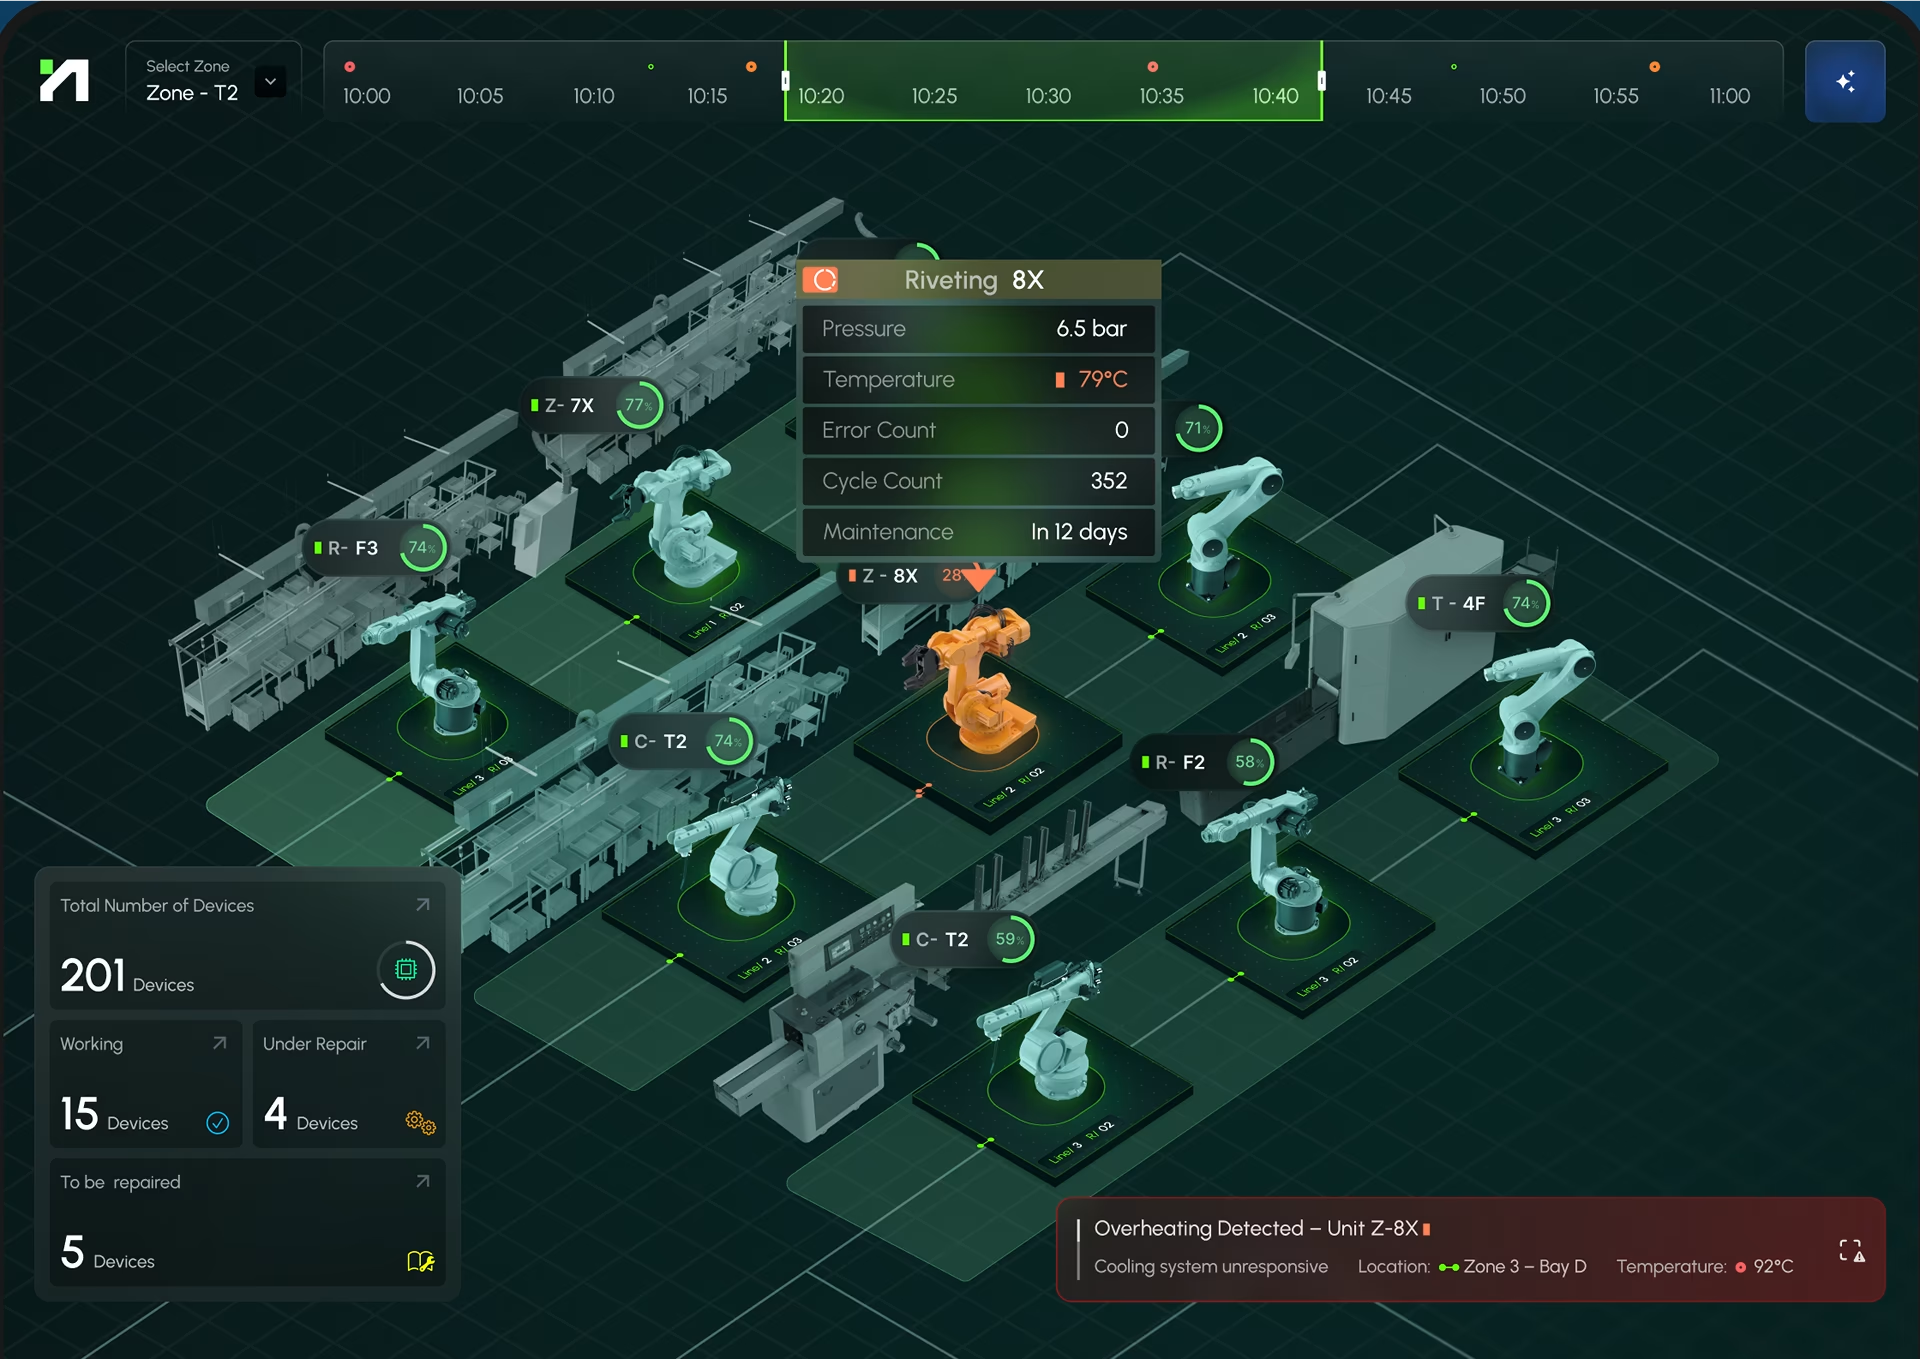
Operators can select individual devices by type, including Cutting, Riveting, and Labeling units, and make real-time adjustments to positioning, rotation, and assignment directly from the interface. An interactive 3D model provides immediate visual feedback during calibration so operators can confirm adjustments are accurate before resuming production. The 3D model is also part of the AR goggles experience, allowing operators on the floor to interact with a spatial representation of the equipment they are working with rather than reading from a flat screen at a distance.
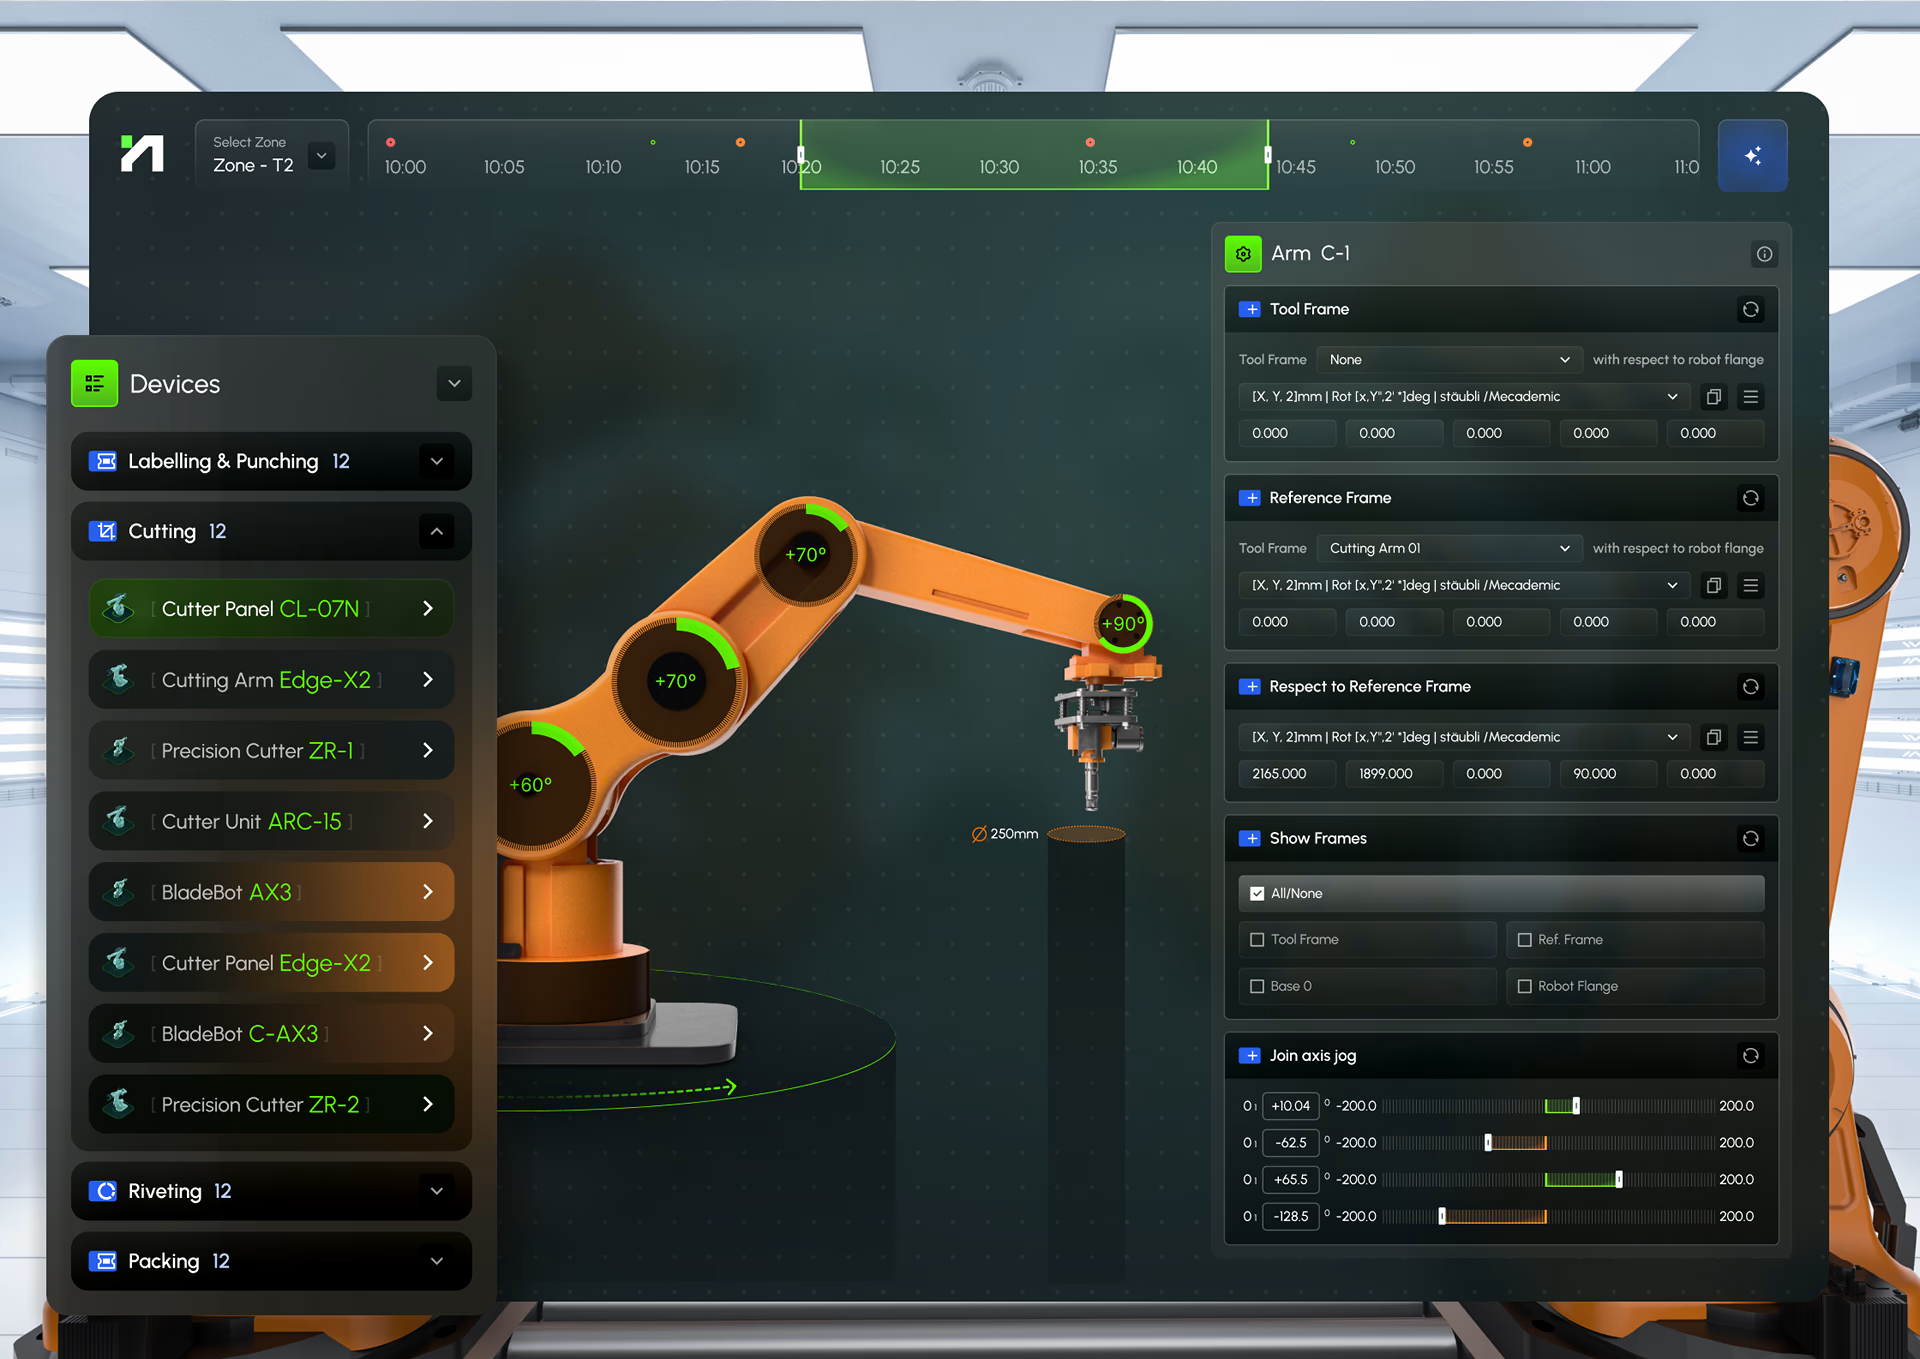
Real-Time Robotic Arm Monitoring During Live Operations
The monitoring interface gives operators real-time oversight of robotic arm performance during cutting operations along the conveyor line. A top-down visualization shows exact tool movement with instant controls for Free Run, Pause, and Stop states. Iconography, color-based indicators, and spatial cues allow a manager to assess the state of an entire operation in a single glance rather than reading through sequential status fields. The same visual language is consistent across the desktop dashboard and the AR goggles interface, so operators moving between both surfaces do not need to relearn the interface as they change contexts. See how Fuselab approaches industrial interface design for environments where split-second clarity is a safety and productivity requirement.
Machine Performance Indicators
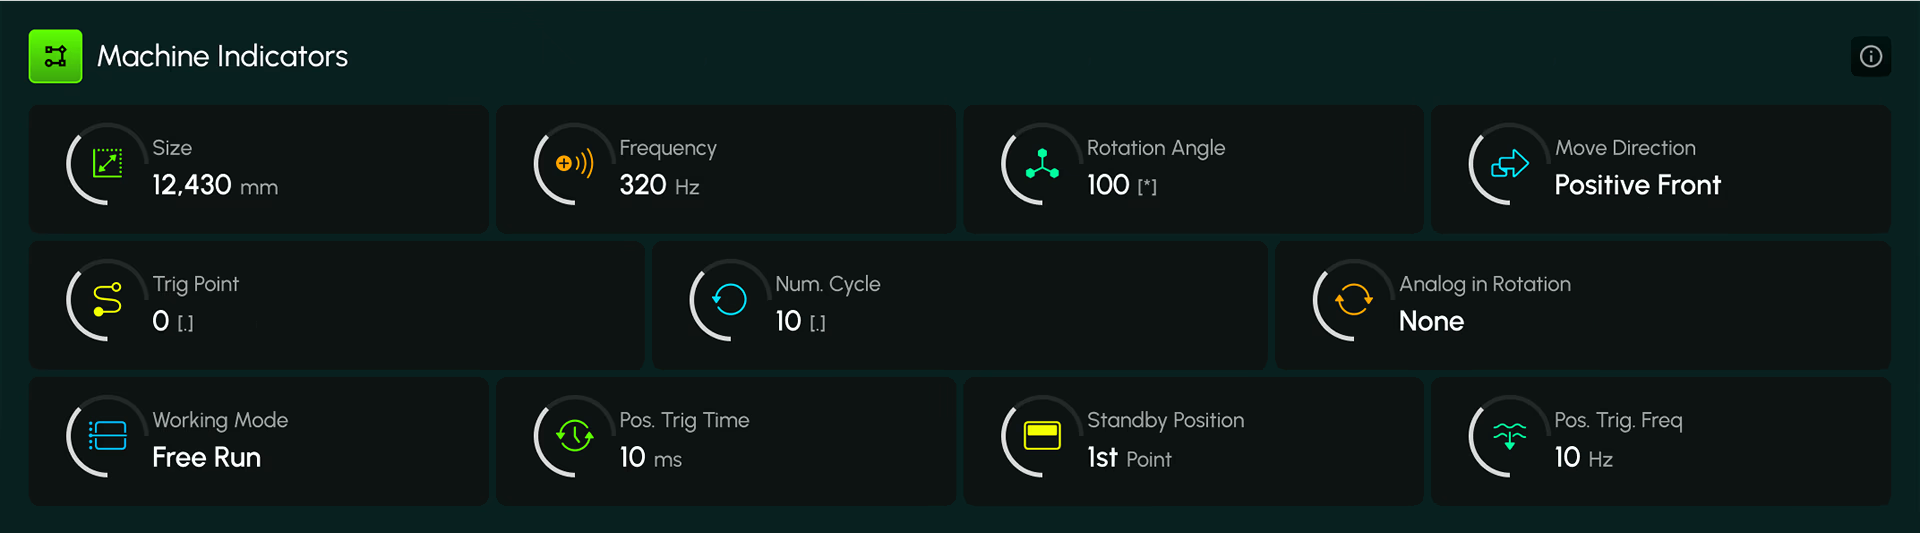
Reading a robotic arm’s status from a data table takes seconds. Reading it from a color-coded indicator with the right iconography takes a fraction of a second. In a live production environment that difference matters. Hyperfab’s machine performance indicators were designed so a floor manager can assess the operational state of every active unit in a single visual scan, without stopping to interpret text or numerical readouts. The same indicator system works identically on the desktop dashboard and through the AR goggles, so operators get consistent information regardless of which surface they are using.